 Login as

I often see clients who ask me to simulate rendering listing ads for their new businesses.
I am writing this article because I thought my estimated averages that I use in creating a simulation model might be off from actual average values.
What is an average click-through rate (CTR), and what is a conversion rate (CVR)?
If an account is your existing account, you already see its CTRs and CVRs; the estimates are easy to make. However, if the account is a new account, such is not the case.
Even if the account belongs to the same line of business as the accounts I have, various factors come into play when running a simulation, such as the landing page, name recognition, unique selling point, or seasonality.
In a case like this, multiple estimated CTRs or CVRs are often used as conditions for simulations.
I also run simulations often with estimated CVRs at 0.5%, 1%, or 1.5%.
The reason for choosing 1% with ±0.5% margins for simulations is that I presume the average CVR to be 1%.
Is the real average CVR 1%?
While I was creating a simulation model, I started to wonder if the actual average CVR is 1%.
This is all because the cases where the CVR exceeds 1% are not rare in my accounts.
Therefore, I decided to research what a real average is.
Data Collection and Aggregation Rules
In calculating the average, the accounts that we can aggregate are limited to those we have.
Fortunately, since we have many accounts, we can derive a decent average.
We used the following data collection and aggregation method because the differences by the search ads, display ads, and devices are all reflected in the outcome.
- Limit the search ads to Google only. (The time would run out if we gather Yahoo! ads for the entire period.)
- Perform separate calculations for search ads and display ads.
- Divide data by personal computers (PCs), smartphones (SPs), and tablets (TBs).
- Aggregate annual data to secure enough total numbers.
- Aggregate all data this time irrespective of how CVs are defined.
This research included many lines of business and was limited to the accounts we have, so we can say that the resultant averages apply neither to all nor to certain limited accounts.
Please look at the results with this point in mind.
The CTR and CVR change when you start using expanded text ads or additional options, but because we are talking about averages here, please understand that we are not going to analyze the causes behind why higher averages are obtained.
The result of the calculation can be seen below.
Calculations by Search Ads and by Display Ads across All Devices
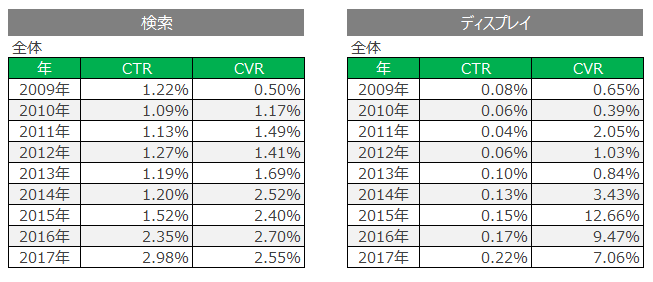
The CTR significantly changed before and after 2016 and the CVR before and after 2014 in search ads.
There must be some changes implemented in AdWords in 2014 and 2016.
Concerning display ads, despite the fact that the CVR in 2015 was an anomaly, the CVRs remained at a high level after that.
Something must have happened around 2015.
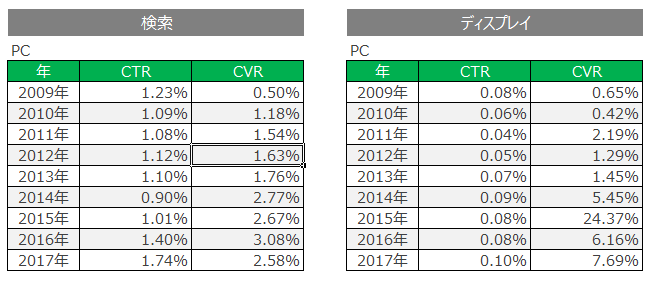
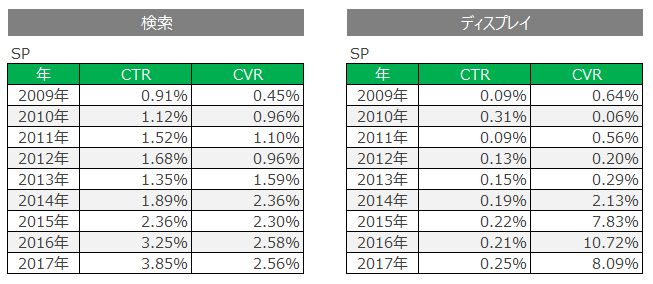
Calculations by Device
The data were divided by device.
Personal Computers
Smartphones
Tablets
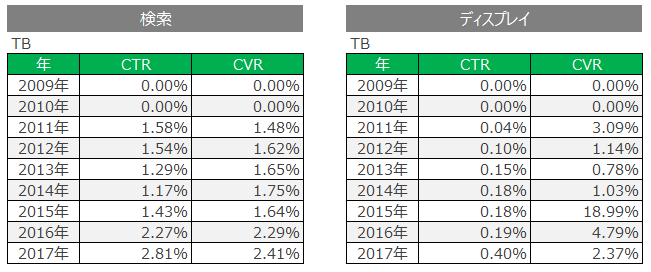
The CTR did not change in search ads on PCs in 2014.
It was the CTR on SPs that increased in 2014, and the CTRs on PCs and TBs increased in 2016 and afterwards.
No major differences can be detected in display ads since the CTR is shown by the device, but the CTR for SPs decreased to 2% in 2015 and afterwards.
Just as you see in search ads, something happened for SPs in 2014.
You can think of a reason. For instance, the measurement of telephone number tapping became more prevalent then.
Summary
After looking at the results, the averages for CTR and CVR seem to be rising every year.
It is very likely that the averages are changing as systems precision improves, and the diffusion of smartphones rises.
However, you cannot trust these numbers blindly because there are changes in metrics that are required of listing ads. For example, regarding the definition of CVs, those accounts whose CVs are set to telephone tapping and the view of a certain page are included in the total in this research.
We need to take the results as averages and adjust them properly according to each account.
These figures will continue to change according to various updates that are implemented everywhere.
We want to keep our presumed estimates updated as well.


;>/img/banner/partner $url=>$index; .png)
No comments yet.