 Login as
What Is a Concept Diagram?
It is a technique for graphically presenting a website’s concept such as the reason for its existence or its goals.
It is one of the techniques that information architects (IAs) in U.S. web consulting firms were using as the standard in the late 1990s. When I was working for Scient, Sapient, and Razorfish, I was able to look at many concept diagrams as project products. Concept diagrams are directly connected to any company’s business models, so delivered diagrams do not circulate in public.
Upon the bursting of the internet bubble, leaner and more agile techniques emerged, so the concept diagram disappeared before it started being widely used in Japan. Because the method of drawing had not been systematized, it differed depending on each individual or project.
I have recently been advocating for revisiting and using this technique in the key performance indicators (KPIs) and the key goal indicators (KGIs) in measuring a website’s effects.
What Should Be Presented Graphically, and What Is a Concept?
- Identify the stakeholders.
Who is involved? The first thing to do is identify the stakeholders who are involved in the usage and operation of a site.2. What are the stakeholders’ thoughts?
What does each stakeholder want to do with the site? The stakeholders have their own intentions and thoughts, even if they are not as clearly defined as their goals.
- How to Illustrate the Concept of a Website to Include it in the Analytic Requirements
I only had a week left until the live presentation on Ustream about a proposed website improvement. I could not start and finish the presentation with mere idle talks, so I wanted to present important points and end the presentation at a point where I could request the proposed improvements to site creators.
Grasp the Whole Picture of a Website
Therefore, I decided to create a clean copy of the diagram drawn on the whiteboard at the time of hearing to explain the issues and direction for solutions. The difficult parts were:
- What to draw and in what granularity
- What meanings to give to sizes of shapes and placements in a diagram
I used an application called Adobe Ideas on my iPad to draw the diagram because it was a weekday and I was on my way to work.
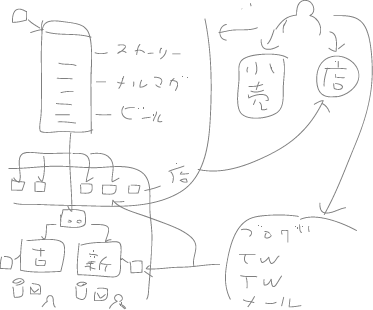
Looking at it later, the diagram inclined heavily towards the site structures.
After further thought, the diagram was revised on PowerPoint and is shown below.
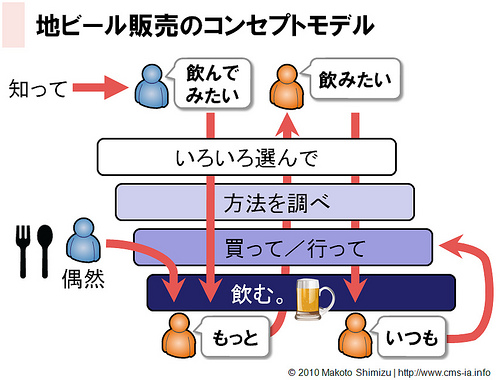
Concept Diagram
There are meanings to the vertical and horizontal placements and the deeper/lighter colors.
From here, I mapped the functions and contents of the site onto this schema.
Concept Diagram of the Site on the Internet (Web, Email, and Twitter)
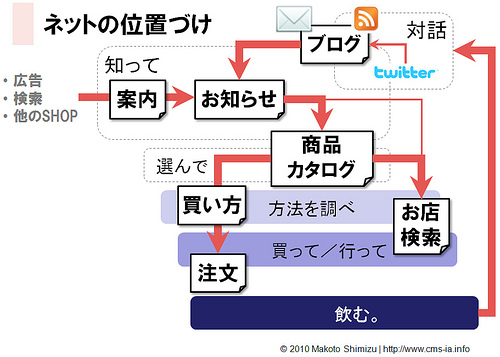
As a result, the pages that needed improvement became apparent. For this site, sufficient services and follow-ups were provided to repeat customers, so it was important to increase new visitor purchases as well as cross-sell and up-sell to the users who had made a purchase. I concluded, therefore, that the contents of pages such as information, notification, product catalog, how to buy, needed renovation. It might be more accurate if I said that I visualized my hypothesis of “it probably is so.”
Map the KPIs and Indices
Furthermore, I also mapped the indices that were obtainable in access analysis as well as those indices that would need to be monitored to measure the effects of the upcoming renovation and daily operations thereafter in a fixed point surveillance.
All the arrows indicate the places of importance. When the indices are not readily available, you need to make them available yourself. Be sure to incorporate measuring sticks to know what we want to know and what we should know.
In creating a concept diagram, I have recently been repeating myself to connect the flow in visual illustration as below:
business -> information architecture (IA) -> measurement -> analysis
It is easier when you get used to it, so please make sure to use it in your practice.
How to Draw a Concept Diagram
December 1, 2010, 23:45
I created a concept diagram for an e-commerce site (EC site) for a local beer brewer selling its beer. I want to introduce my Ustream video titled:”IA Channel: How to Optimize Your Corporate Website,” where I presented this concept diagram and received favorable feedback, saying, “I was able to organize my thoughts,” or “It was easy to understand.”
How to Draw a Concept Diagram
First, I organized myself to grasp the positioning of this EC site while gaining insights into the characteristics of the business model of local beer sales.
The Characteristics of Local Beer Sales
- Its genres or brands are not well known.
- There are few stores or bars where you can buy or drink it.
- They sticking to the thought of “all must be ale” despite the fact that most Japanese beer is lager.
- It is suitable as a gift because it is unique and high-priced.
- A shipping charge is not negligible if you buy it on any webstore, so vendors will recommend it if they can buy it somewhere close.
- The combination in a set varies depending on the webstore.
Three Types of Prompts in Visiting a Site
- Visit a particular site after learning the brand name on the media.
- Visit a site after searching for keywords, such as 地ビール (local beer), ギフトビール (gift beer), or スイーツビール (sweet beer), and learn about it.
- Visit a site to buy some because of the experience of drinking at a bar.
I continued mapping the functions and contents while I considered user behavior or psychology changes, what significance it has on the business, or with whom and how the business want to influence customers.
Beer needs to be drunk by someone. However, the beer is not a major brand beer, so you cannot find it in a nearby supermarket or bar. If you want to drink it, you need to find a store/bar that carries it and go out to get it, or otherwise buy it online.
The main route of purchase is online because the number of stores/bars that carry it is small, and it is rare to find it nearby. However, due to their history, the local beer brewer owns two official online shops. The brewer needed to explain the difference between the two shops on their website.
The reason behind distinguishing the simple act of drinking beer and emphasizing it is that there are many ways to enjoy fresh ale with live yeast as a luxury beverage. Beer from a barrel tastes better than in the bottle; the foam is different if a server is used; the glasses come in different shapes and sizes; and the temperature and freshness are important. There are ways to enjoy it that you cannot do at home.
You need to appeal to the consumers: “Once we have you drink some, regardless of the means, we want you to be our fans and continuously drink it. For that to happen, we have products like these; these are the ways to enjoy them.”
I drew the diagram so that a website that appeals as above should be illustrated.
If you pack various aspects of a site into the diagram from the get-go, the diagram will become too complicated, so I first modeled user behaviors and then mapped the functions and contents the site needed to have.
What You Should Keep in Mind in Expressions
If you use a diagram, the amount of information will increase compared to it being only in text.
- Placement (vertical, horizontal)
- Size
- Color
- Font
- Shape
- Icon
You need to give each a meaning to express what you want. The priority is on the ease of understanding, so it is important for the consistency and accuracy to take a back seat to some extent.
What Do You Want to Express?
A concept diagram is a graphical illustration of a concept. Please note that a concept diagram is not just a drawing to which actual structures are objectively mapped; it is a means of communicating and representing the concept in a graphical illustration. For this purpose, be sure to clarify what you want to express before and during the creation of your drawing.


;>/img/banner/partner $url=>$index; .png)
No comments yet.