 Login as
One of the most significant challenges any business has in any industry is how they optimize the content on their websites to not only get traffic and increase customer activity but also to see what customers are doing on their page. That is where Heatmap tracking comes into play. Heat maps or visually represented data was originated by a financial markets analyst to allow better deals to happen between traders and stay ahead of the commercial market forecast. If you knew where there was more or less activity, then you would be able to make more money, sales and even adjust what was live on the trading page.
Heat mapping comes with many functions and features if the brand knows what is useful. These features include hover mapping (also known as eye tracking) which tracks the movement of the mouse on the page over elements. Click mapping which lets you see what parts were clicked the most and if you need to modify the representation of the page due to features that are not actively useful being mistaken for clickable elements.
Then there are scroll maps which allow you to track the scroll depth of the page and will enable you to modify the content, construct and options on your main pages, especially your homepage. All of these options should include device specific options because as we know, mobile traffic is now one of the most substantial traffic source for browsing. This feature should consist of mobile phones, tablets, laptops, and desktops. Each element should be able to correctly dissect each item and tell you how those users reacted to your page.
An American Statistician summed up what he defined as cluster heat maps or as we would call them algorithmic heatmaps in this quote in which he refers to it with the prior name before more developments were done, “The cluster heat map is an ingenious display that simultaneously reveals row and column hierarchical cluster structure in a data matrix. It consists of a rectangular tiling, with each tile shaded on a color scale to represent the value of the corresponding element of the data matrix.”
To put the above more simply, the combination of heat map tracking systems gives you the ability to use data to visualize movement and make a more educated guess of elemental, functional and design improvements. It becomes like the topographical map on google telling you where the high points and low points are and where you can adjust course to increase effectiveness. You didn’t have to hire a statistical specialist for that summary.
Now that the complexities have been spoken about, what does this have to do with business overall? It is simple really; most companies fail in modern times because they cannot adapt, track and scale. If you ever hear of a business closing, it is usually because one of these critical elements is abandoned or ignored. From the mighty companies like Enron which saw profits over sense to the smaller firms like Netflix which has had to optimize its model of charging as well as scaling we see this in everyday business. The simple message is that you cannot cut corners and be useful in business and this goes with website design and performance as well.
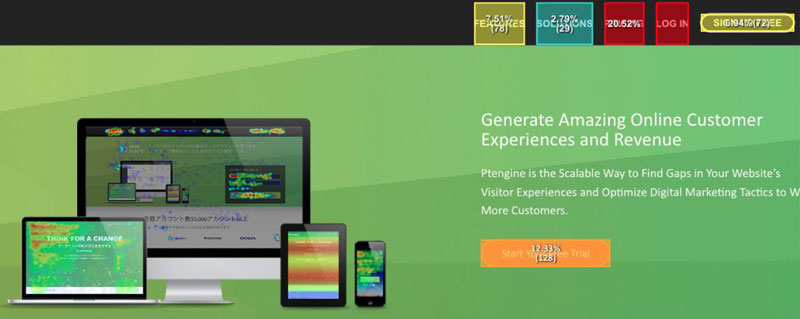
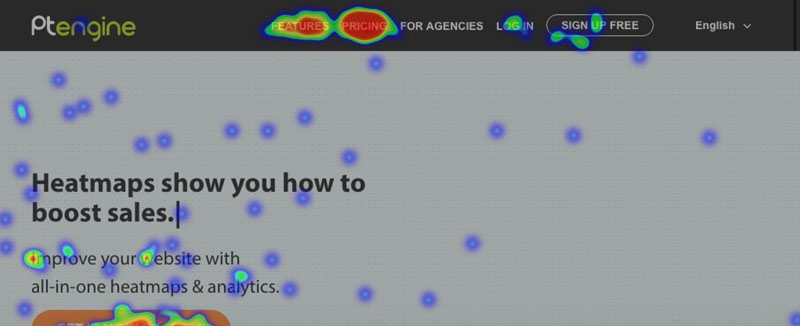
Now let’s cover some applications and case studies of heatmap users within our system that have reported success with the insights. In this example you can see there there are some notable actions taking place. One of them is that the icons with the red color are getting the most activity and when you look at the lighter colors the activity has dropped off.
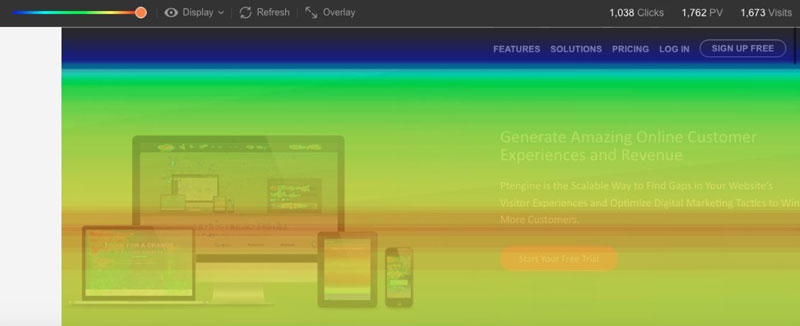
In the next you can see the scroll feature in action and why it is important to know where users spend the most time on the page, so those areas can be optimized.
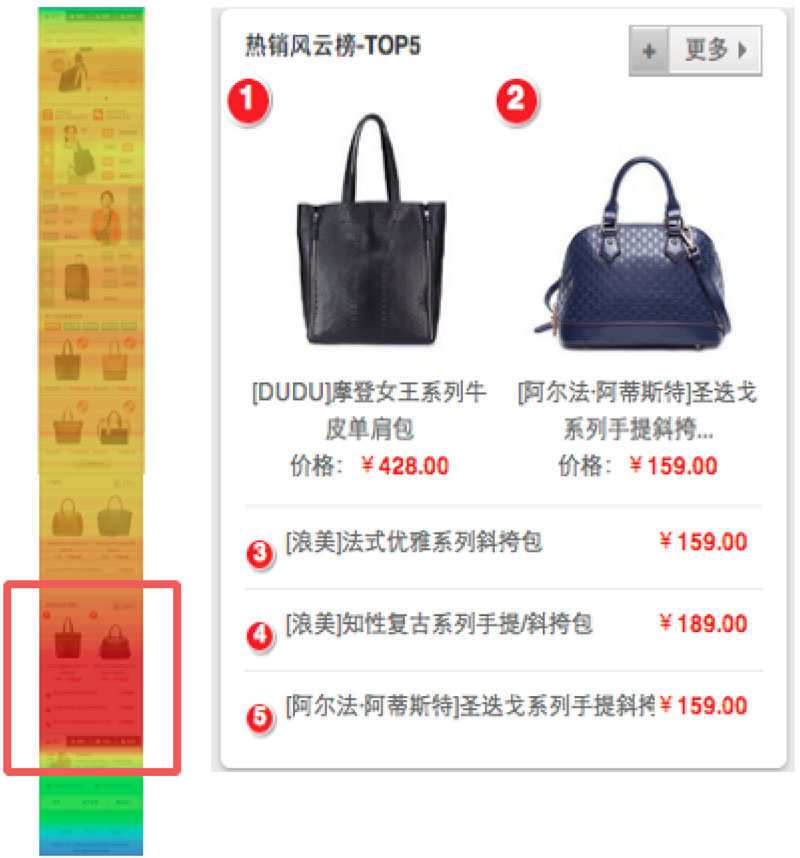
You can see by the comparison that the users were scrolling down to a particular section and that is an area that could be optimized for conversions.
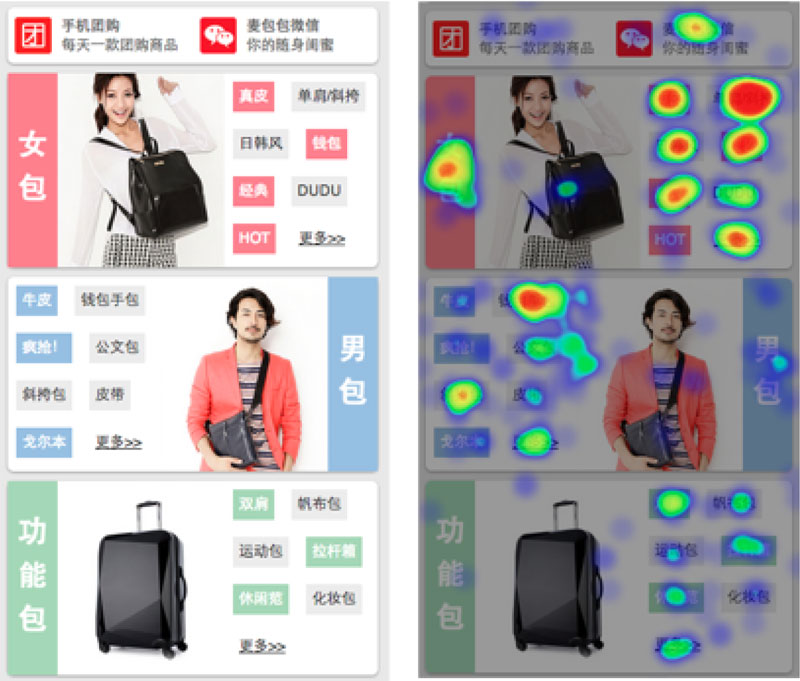
This insight gave the users not only an idea of what would sell best, but what kind of items their user base was interested in as hot items. This allowed changes to be made and sales to increase.
The above are just some of the many reasons why Ptengine has evolved into the powerhouse for heat mapping and tracking in the world. We have taken all of the fundamental aspects of tracking and mapping and made them better by using overlay systems that show you not only individual pages but both single and combined representations of what happens when visitors come to your website. We take care of counting and displaying analytics so that you can capitalize on the information and make changes immediately. We take trends seriously and adapt as needed to help you win every time; we invite you to give our product a try to help you simplify and increase the effectiveness of your online presence.
Written by Luis Rivera
Ptengine Support Expert


;>/img/banner/partner $url=>$index; .png)
No comments yet.