 Login as
Exploring the causes of the effects of the “Blue Pond” on Biei’s tourism
The “Blue Pond” wallpaper on MacBook Pro launched by Apple Inc. in 2012 increased the number of sightseeing visitors but decreased the number of accommodation guests. What is behind this phenomenon? In this article, I will explore the status and causes of this occurrence by applying web analytics.
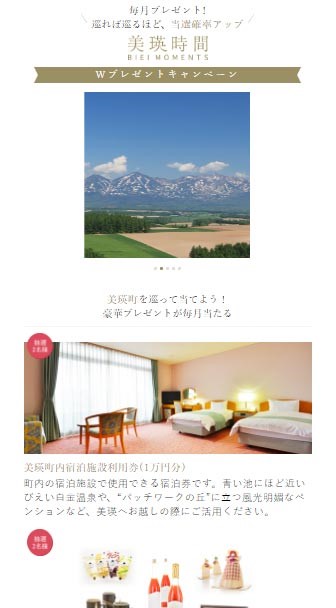
First, please see the beautiful scenery of Biei in Hokkaido, Japan.
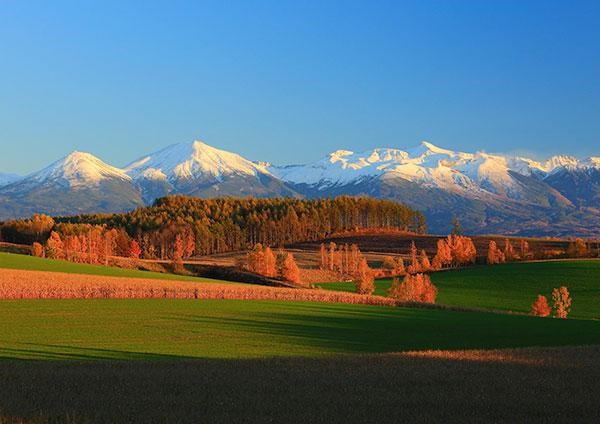
Photo by Hirokazu Saito
The most attractive part of Biei is the pastoral scenery with beautiful, rolling hills into which the majestic nature of Mt. Tokachi and people’s activities are woven.
The Blue Pond is one of the popular sightseeing spots in Biei. Because of the photo of the pond used on Mac, the pond became widely known to people; visitors gradually increased every time some online media or a magazine took up the pond until a TV program featuring the pond in 2014 spurred the rapidly increasing visitor count.
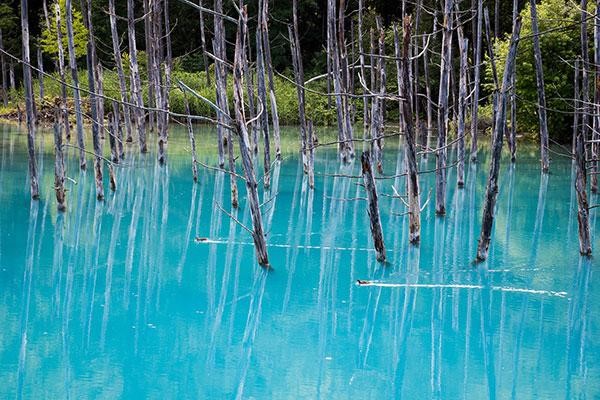
Photo by the author (This is not the MacBook Pro’s wallpaper “Blue Pond.”)
However, what increased was the number of pass-through visitors, while the number of accommodation guests who create a positive economic effect decreased.
The miraculous, superb view called “the patchwork hills” will entice the visitors.
Second, I will explain Biei’s tourism situation to give you the background information.
The landscape photographer Shinzo Maeda’s masterpiece “Bakushu-Senretsu (vividly bright autumn wheat)” first prompted a wide recognition for Biei in 1977; Biei is one of the sightseeing spots that represents Hokkaido, and over 1.6 million people currently visit there annually (p. 11 of 2017 Biei Census Handbook), seeking solace in the pastoral landscape and beautiful hills.
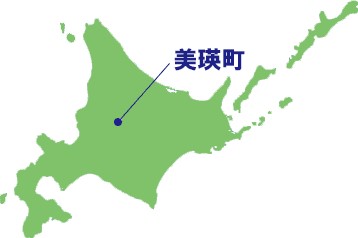
The location of Biei
The shades of colors from the agricultural produce and flowers raised in the dotting fields on unique hillsides create a patchwork look on a large stretch of land. Also, due to crop rotation, the same produce is never grown in the same patch continuously, so different color-combination patterns create an even more attractive hillside scene every year.
Biei’s characteristics are that the agricultural activities themselves constitute the sightseeing resources.
Biei’s Blue Pond has become a popular sightseeing spot…
Biei’s popularity was pushed up even higher by the Blue Pond. However, you can see the result of the popularity in the following graph.
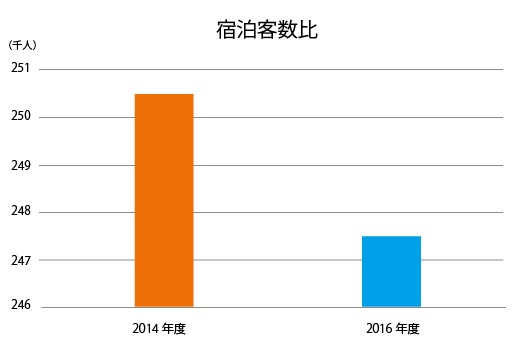
Comparison of Japanese hotel guest counts between 2014 and 2016
Biei had been a resort spot for middle to senior generations. They visit Biei every year, staying at their favorite bed and breakfasts while letting the seemingly slower Biei-time flow and enjoying the seasonal vegetable dishes.
However, the Blue Pond boom caused congestion in every nearby parking area and arterial highway; therefore, those middle to senior generations who brought revenue to the area started to look for alternatives to Biei.
Making Sense out of the Status with Web Analysis
To improve this situation, I first attempted to make sense of the current status.
Biei Travel Association’s website communicates sightseeing information. I used the site’s data obtained through Google Analytics.
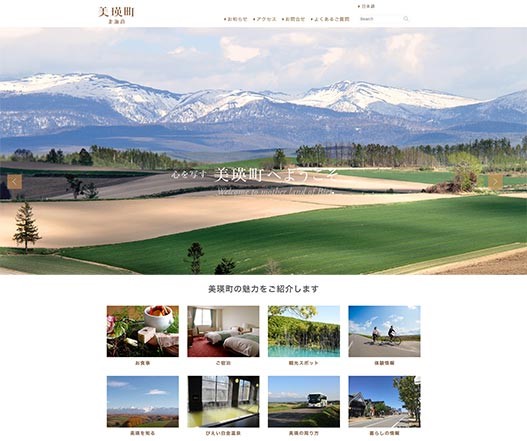
Biei Travel Association website
https://www.biei-hokkaido.jp/ja/
I checked the site’s access user count, user attributes as well as page view count because people usually gather information about the places they visit before they leave; so, I thought I could get some insights from the site’s web analytics data.
User Count
Ever since the Blue Pond became a hot topic for discussion on the Internet, the site’s user count has jumped by a factor of 2.6 times of what it was.
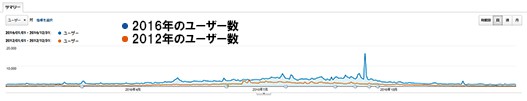
Comparison of user counts between 2012 and 2016
The site’s user count kept increasing every time the media picked up the pond, and the 2014 TV special caused the site’s popularity to soar, as you can see from the data.
Users’ Attributes
Next, I looked at the users’ attributes.
Google Analytics provides website users’ fundamental attributes, such as sex and age, on an estimated basis in a report. As you can see in the report, a comparison of the attributes of the users between 2014 and 2016 revealed that the number of younger users had gone up while the number of middle-aged or senior users had gone down. Those two years were before and after the Blue Pond boom, respectively.
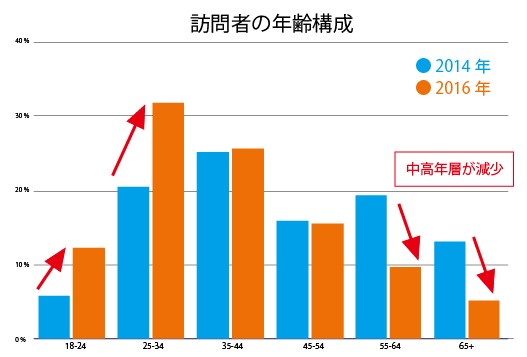
Comparison of user generation shares between 2016 and 2014
Page View Count
The average page view count in 2014 was five; however, in 2016, it fell to three.
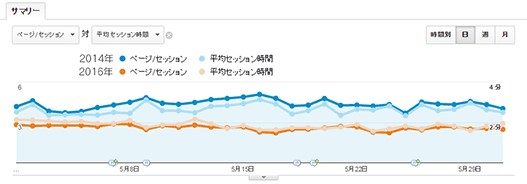
Comparison of page view counts between 2016 and 2014
I consider that there was an increase in the number of site’s users who first check only on the Blue Pond, get satisfied, and leave.
You can see the differences before and after the 2014 boom from the analytics data.
I can vividly visualize from the data that those middle-to-senior generations who used to visit there were disheartened by the actual circumstances of Biei, where they could no longer spend a relaxing time, and stopped their visits.
Estimating Sightseer Count with Web Analytics
Besides understanding the current status, we had started an initiative in 2011 to estimate the number of sightseers who visit Biei, and various ways have been tried to improve on the accuracy of the estimate.
For example, we conduct questionnaires for sightseeing visitors on a regular basis by utilizing the visitor counting devices placed on various sightseeing spots.
I will show you a case where the sightseer count was estimated from the web analytics data of the site based on the result obtained through a visitor count survey conducted for a certain period at the Blue Pond, which attracts most visitors.
Estimating Sightseer Count form the Site’s Mobile Data
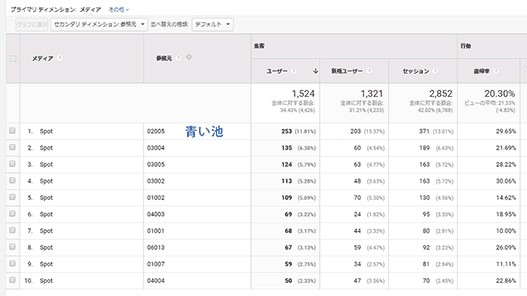
We placed our focus on the top 10 pages of the site when we attempted to estimate the visitor count.
The page with the highest visitor count is the Blue Pond page.
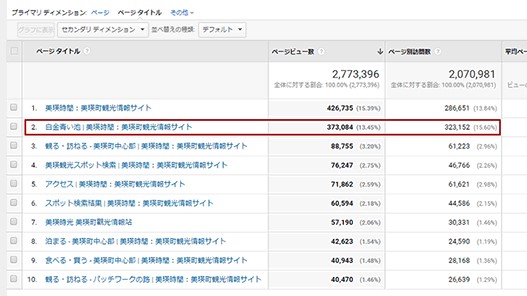
The site’s visitor count by page
Next, if you look at the data by device, access to the Blue Pond page via mobile devices is tops with over 70% of sharing.
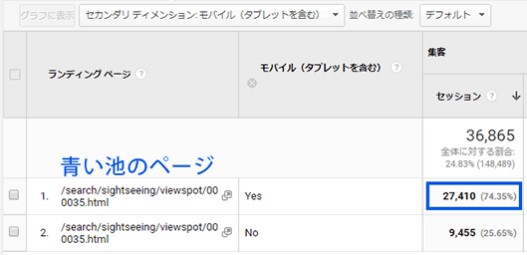
Access to the Blue Pond page: Mobile users share 70%
We compared our estimate with various data, and we found a certain correlation between the mobile user count and the number of sightseeing visitors to the Blue Pond.
From this result, we gathered that the number of the tourists who visit the Blue Pond can be estimated from deducing the mobile user count of the Blue Pond page.
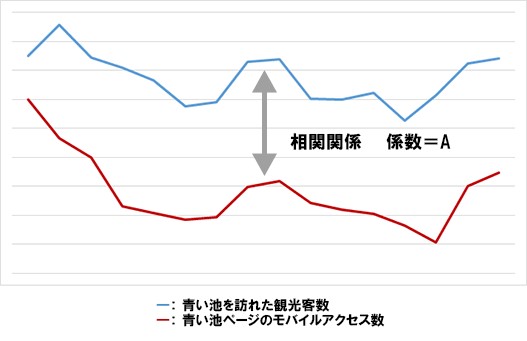
Number of tourists who visited the Blue Pond and that of mobile users who accessed the Blue Pond page
Thus, we came up with the following formula:
- [Number of tourists who visited the Blue Pond] = [Number of mobile users who accessed the Blue Pond page] * [correlation coefficient A]
Similarly, we were able to obtain an estimate of the visitors to the entire Biei by multiplying the mobile user count on the site by the correlation coefficient A, used for the derivation of the Blue Pond visitor estimate.
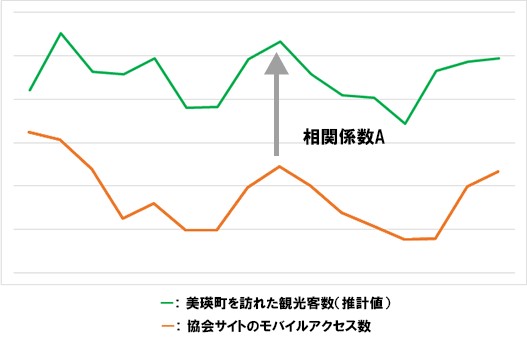
Number of visitors to Biei and that of the site’s mobile users.
Thus, we also have the following formula:
- [Number of visitors to Biei] = [Number of the site’s mobile users] * [correlation coefficient A]
I consider these estimates are highly reliable because the actual figures practically match up with the estimates obtained using data from July 2015 traffic survey.
We placed a QR code at 200 locations, including sightseeing spots to analyze the behaviors of visitors.
We also launched a questionnaire campaign to survey how visitors sightsee Biei.
Questionnaire campaign website
https://biei-fan.jp/jp/all.php?
Visitors could not respond using this page because it was only for the campaign promotion. They could participate only by using the QR code placed at sightseeing spots.
The QR code with unique parameters was placed at 200 locations including sightseeing spots, accommodation facilities, or restaurants that visitors use.
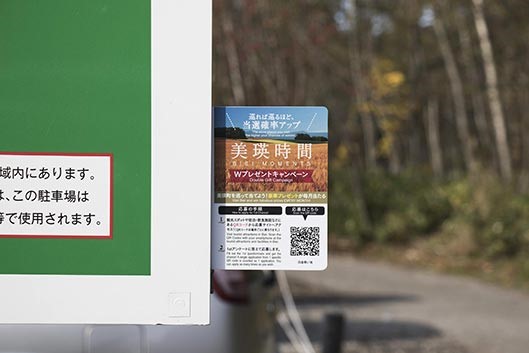
QR code placed at sightseeing spots
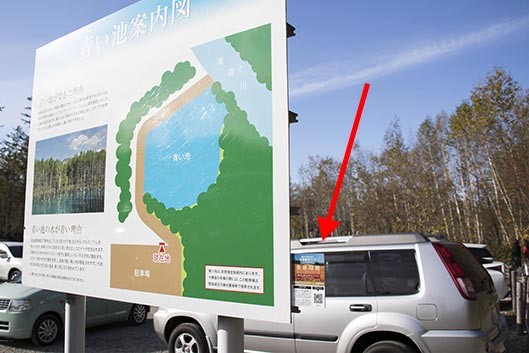
QR code placed at the Blue Pond
We analyzed the visitors’ behaviors by comparing the data obtained via the QR codes and the site’s analytics data.
User Behavior: Sightseers visit tourist spots two hours after visiting the site.
The analytical result of the Blue Pond questionnaire campaign is below.
Data via the QR code
The sightseeing spot with the highest number of QR code scans is the Blue Pond.
I compared the time distribution of the number of users who accessed the Blue Pond page with that of the number of QR code scans.
There is little difference between the two sets of data in the morning, but after the noon, the trends match if you take the QR code data and shift them two hours backward.
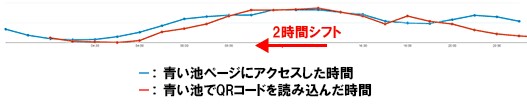
Time distribution of the number of users who accessed the Blue Pond page and that of the number of QR code scans.
From this trend, we can say that those who visit the Blue Pond in the afternoon tend to access the Blue Pond page to locate the place and check the content of the sightseeing spot two hours before they arrive at the place.
◇◇◇
Like I just showed you, web analytics is a convenient tool that can be used for not only monitoring the users’ on-site behaviors, but also
- Understanding the status of tourism
- Understanding the behaviors of the sightseers who visited
In this article, I used web analytics data to find out the status of tourism in Biei. From there, I also showed you how to estimate the number of tourists. With just a little ingenuity, you can gather various sightseers’ behavioral data without spending too much.
If the data can be obtained in this way, you may be able to implement specific measures. For example, if you publish the parking access condition at the Blue Pond on the site to ease the congestion on the main highways, you can use the results to verify and continuously improve on the measures by turning the PDCA cycle.
The process that I introduced here does not necessarily apply to every sightseeing spot, but If you are wondering how to attract tourists, why don’t you begin gathering data from where you can.


;>/img/banner/partner $url=>$index; .png)
No comments yet.