 Login as
By Arun Mani – Web Analytics Master
You are a business that has hired an external digital marketing agency to handle your online marketing efforts. Every month you pay the agency to plan and execute an online marketing strategy that will bring you more paying customers. As time passes, you as a client start to wonder if the money your spending in this venture is making a difference in terms of increasing conversions. Are there ways or techniques that can be used to help you acquire a clearer picture?
Let us start with some basic common methods to measure some aspects of ROI. We will start with looking at very common measures. First, is the metric Cost per click or CPC.
CPC = Amount spend on online Ad / #clicks on the ad.
This is a common metric and is used extensively in Google AdWords.
Next, is Cost per acquisition or CPA. This metric is used to measure how much each conversion or sale costs.
CPA = Total cost of Ads / #Conversions
Finally, we have the metric Return on Ad Spend or ROAS.
ROAS = (Sales Amount / Ad Expense) x 100
The above metrics are basic measures and will help you get a picture of how your online marketing campaign is performing.
Note that the basic formula for ROI is (Profits/ Costs) * 100. Now how do you go from metrics related to a campaign to an overall measure of ROI across all campaigns? For example, how can you measure ROI if your running multiple campaigns in Facebook and Google AdWords? How do you know if it was your Facebook campaign or if it was your Google AdWords campaign that primarily contributed to a conversion? You use attribution. Attribution tells you which of your channels primarily contributed to a conversion.
Google Analytics has a fantastic set for tools to help you with attribution. We will start with the Path Length Report. This report shows you how many conversions resulted from conversion paths that contained 1, 2, 3, 4, 5, 6, 7, 8, 9, 10, 11, or 12+ channel interactions. This report is accessible from the following menus Conversions -> Multi Channel Funnels -> Path Length. Below is a sample report:
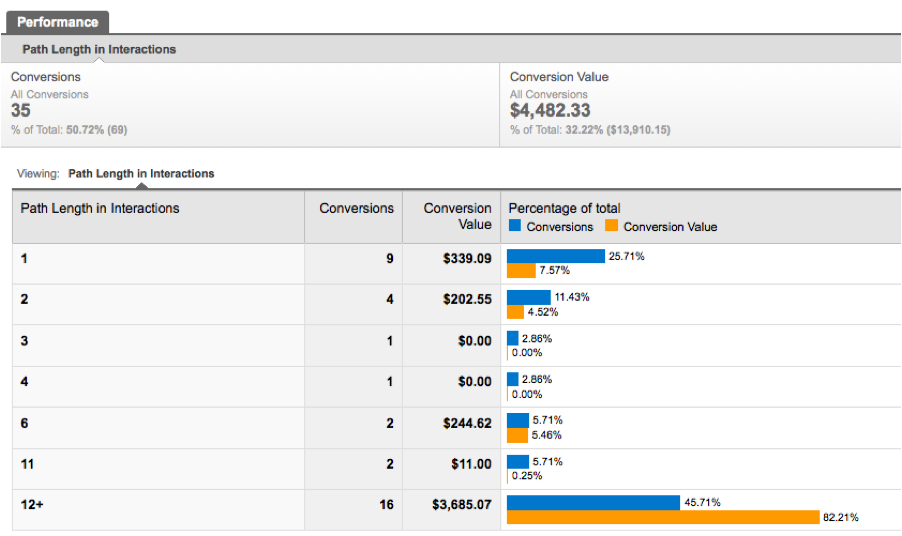
In this example, the path length of 2, basically two different channels were interacted with by users that resulted in four conversions. These four conversions resulted in sales of 202.55$. Most of the revenue resulted from 16 conversions and these conversions were by users who interacted with 12+ different channels. This report will let you know if you have an attribution issue – i.e. how do you determine which channel gets the credit for contributing the most to the conversion. The rule is straightforward: There is an attribution issue if most of the conversions are from path lengths > 1. In the above example, it is pretty easy to see that this is the case (there are 26 conversions) and as a result there is an attribution issue.
Next, the “Top Conversions Paths” report shows the sequence of channel interactions that led to conversions, as well as the number of conversions from each path, and the value of those conversions. This report can be accessed from Conversions -> Multi Channel Funnels -> Top Conversion Paths. Here is a sample report:
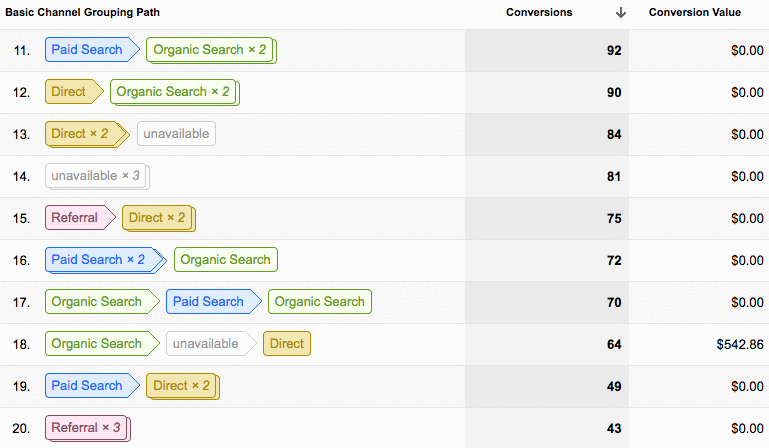
In this example, two clicks on a paid ad then followed by an Organic search resulted in 72 conversions.
You can also view the multi-channel conversion visualizer to determine conversion paths that included combinations of channels. This is accessible from Conversions -> Multi Channel Funnels -> Overview. A sample report:
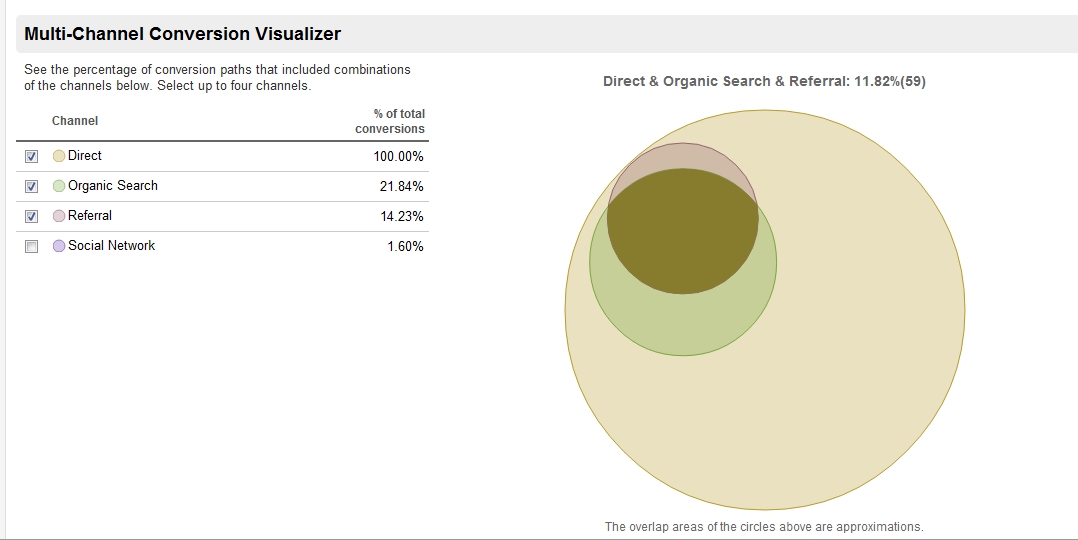
Here 11.82% of all conversions was a result of all three channels Direct, Organic Search and Referral being used.
There are different models that are used to describe attribution. The Model Comparison Tool is accessible as follows: Conversions -> Attribution -> Model Comparison Tool. Once you access this tool you can select different attribution models to view the number of conversions and conversion value as calculated by that model.
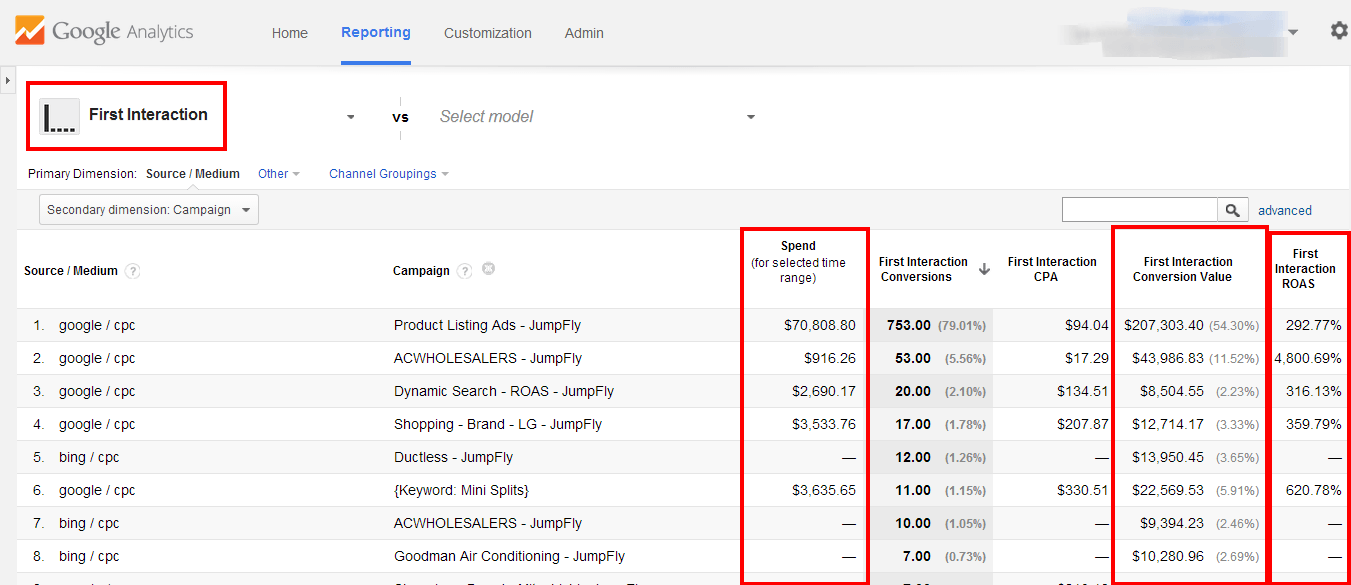
In the above screen shot, we have selected the model ‘First Interaction’. Conversion values and other data is displayed as calculated by the ‘First Interaction’ model.
Let me give a brief description of each model:
- Last Interaction: the last channel that was visited by the user just prior to the conversion gets the credit for the conversion.
- Last Non Direct Click: Credit goes to the last campaign prior to the conversion. Campaign is defined as anything but Direct traffic. Campaign could be Email, Display, Affiliate, Social, Organic Search, etc.
- Last AdWords Click: The last PPC ad that was clicked gets the credit for the conversion.
- First Interaction: The credit for conversion goes to the first click or first channel.
- Linear Attribution: Give credit in equal percentages to all channels visited prior to the conversion.
- Time Decay: The media touch point closest to conversion gets the most credit. The touch point prior to that will get the second highest credit. The first touch point will get the least credit.
The most realistic model from the list above is Time Decay and this model can be used in your analysis.
In conclusion, I’ve covered the very basics of attribution. As stated before, Attribution plays an important role in determining your ROI.


;>/img/banner/partner $url=>$index; .png)