 Login as
By David Chan – Web Analytics Master
How I single out high value customers to increase profit.

Wouldn’t it be nice if you could identify the profile of your high spending customers, 80% of your profit from 20% of your customer – The 80/20 Rule. Technically known as Pareto’s Law, or the Pareto Principle.
Why is it important for my business?
If you are able to identify them, know more about them then you can be more specific with your marketing. You can create touch points and content message to engage them, build trust and convert them. In my example I know male between age 45 – 54 has a great spending potential.
With this in mind I can make good assumptions like:
1. high percentages of them likely to be married
2. income should be around than $7,000 – $12,000
3. strong interest in ageing related content
It need not cost you an arm or leg, I use simple free tools which most businesses already have to identify customer having $611 average spending.
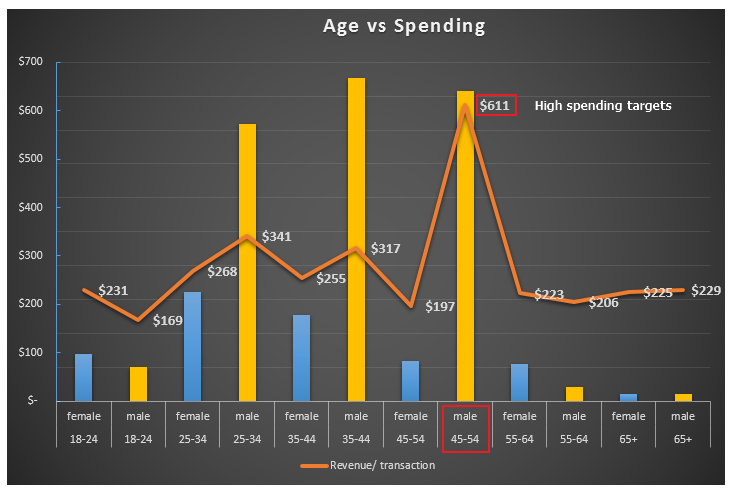
$611 average purchasse
Let’s get started, tools I used:
- Microsoft Excel
- Google Analytics
Step 1: login to google analytics
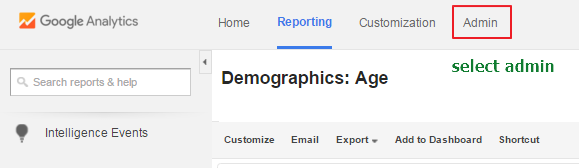
Select the admin tab
Select the view you want to analyze
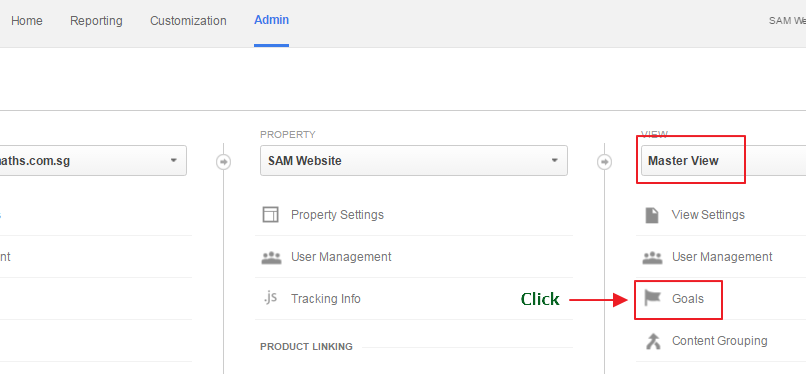
Step 2: setup goals in google analytics, if you already have goals setup you can skip this step
Depending on your goal objectives choose the right template, for the example we are using destination type
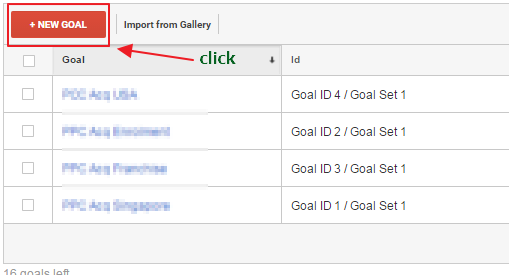
Add a new goal
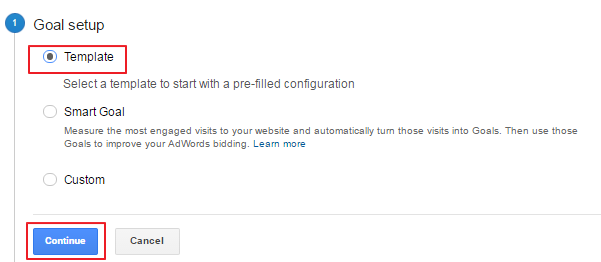
Setting goal – step 1
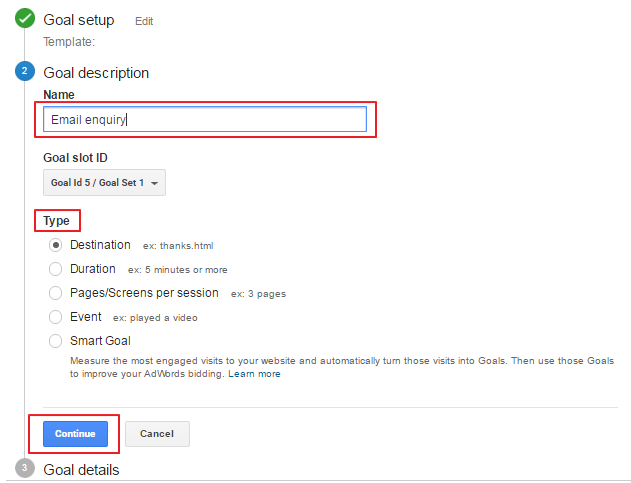
setting goals
Step 3: Setup goal value, most users don’t step up value. One main reason is they are not able to determine actual value, for web analytics we don’t necessary need this value to be 100% accurate. An estimated value will be enough, as this will add another info into the data sources. For this example we put it as USD 50.
However, if you have a eCommerce site you need not use this value since GA captures the transactional value.
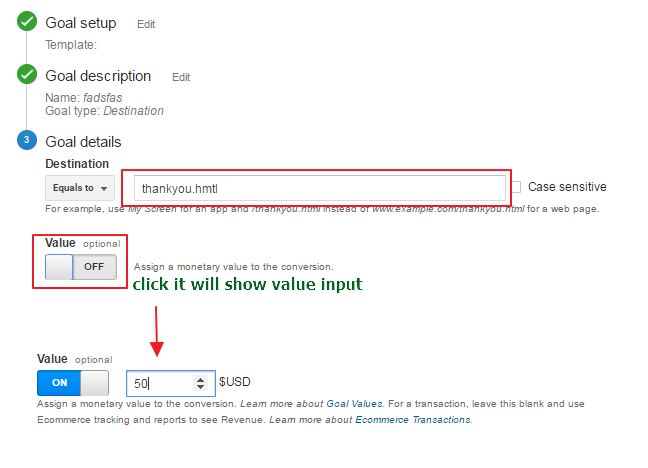
setting goal value
Step 4: navigate back to reporting and select audience
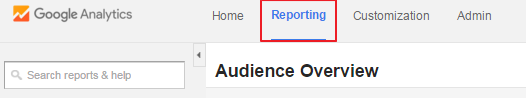
Select reporting

Go to audience options
Step 5: Segment with secondary dimension, segmentation allows you to gain more information about the subject you are analysing; in our case the gender
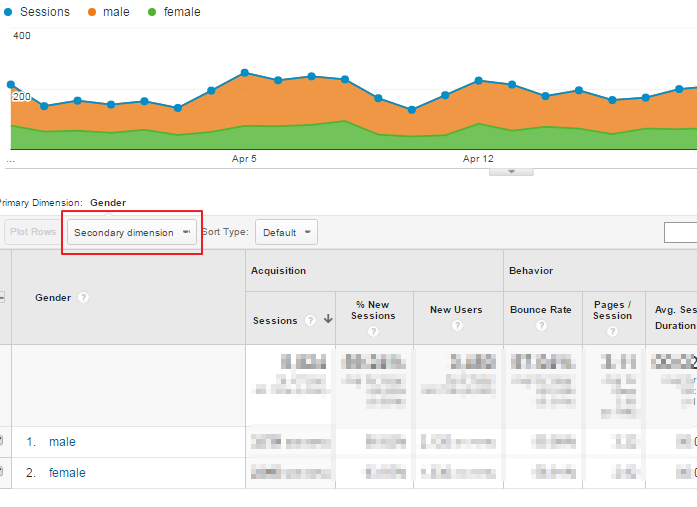
Add secondary dimension
Step 6: configuring secondary dimension, if you are unsure of what secondary dimensions are available, use short cut by typing into query bar and it will show you the drop menu
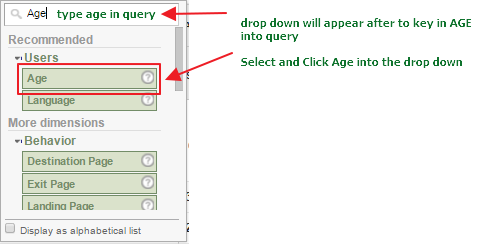
configuring secondary dimension
Step 7 : secondary dimension added
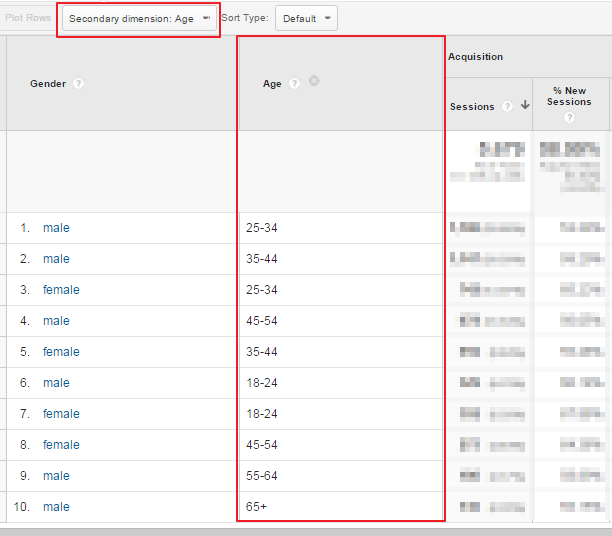
Secondary dimension added
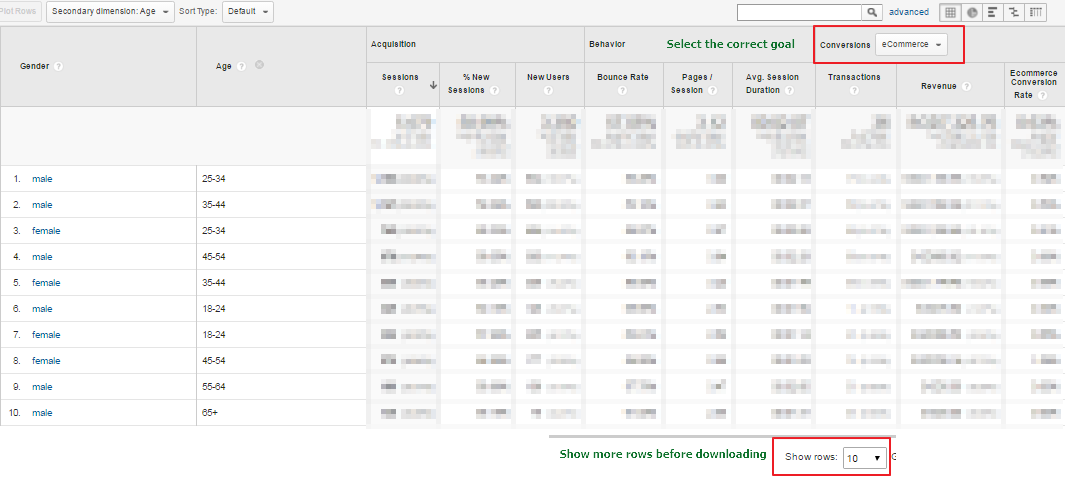
Step 8: if you have multiple goals be careful to select the appropriate goal for analysis.
Also remember to expand the numbers of row to see all the details, recommend to select 50 rows as the default
goal selection
Step 9 : time to start making the graph
download excel file
Step 10: use excel to create graph, in our example we are using the gender and age as the x-axis. You need to arrange the data is this way to plot the graph
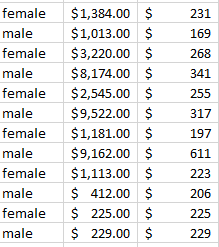
excel data
Final product
$611 average purchasse
Here is an excellent video to help you with making graphs from excel
Now is your turn, if you run into any problem drop me note on the contact form ….. have fun


;>/img/banner/partner $url=>$index; .png)