Hi everyone! This is Takashi at Web Analytics Consultants Association.
Back in July I had the chance to listen to two amazing speakers talk about the purpose of digital analytics. Today, I want to share my takeaways along with additional comments.
Adobe – Digital Analysts’ mission is to bring value to the client

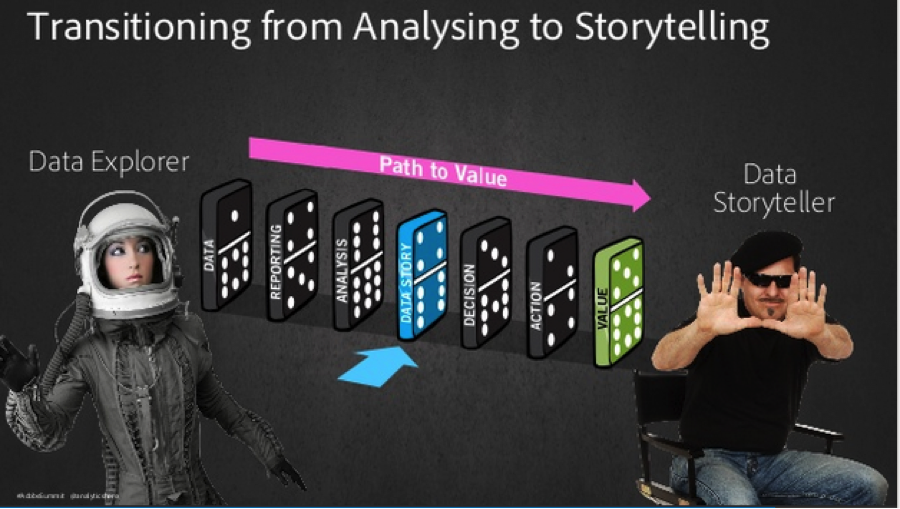
On July 22nd, Siva Ganeshanandan, Director APAC Product and Industry Strategy from Adobe, gave a wonderful presentation at Digital Analytics Wednesdays in Singapore on “Data Storytelling”.
As the person responsible for bridging the gap between business objectives of marketing professionals and the technology that helps them do their job more successfully, Ganeshanandan understands the importance of storytelling when it comes to data.
It’s not only about analyzing data but being able to communicate that information in a way that leads to action and adds value to the client business. I couldn’t agree more with Ganeshanandan.
This has always been a point of emphasis at WACA because time and time again, we find that the key issues in organizations lie in the ability to analyze data and the ability to communicate the insights from the analysis to the relevant departments who may not have the same understanding of data.
For those who want to get a better idea of his talk, check out his slides on Slideshare!
Rakuten – Finding Spinach

Still somewhat related to Adobe, the presentation by Koji Suzuki on July 30th was at Adobe Digital Marketing Symposium Singapore 2015.
In his presentation, Suzuki used a very peculiar case study. According to him, online grocery shoppers in Japan are often hesitant when buying vegetables other than carrots and potatoes online. The reason being that other softer vegetables might be damaged in transit.
As someone who doesn’t shop for groceries online, this makes sense.
However, it turns out that once people buy spinach online, they are more likely to start buying other fresh products like fish or fruits – given that the spinach arrives in good shape.
As a result, spinach has become an important KPI for Rakuten when it comes to online grocery shopping.
The presentation definitely gave me a lot to think about when looking at my own clients because you never know what your “spinach” could be. Check out the blog for a more in depth look at Suzuki’s case study.
Business before data
What both of these presentations have in common is that they put business before data. As a data-nerd and a WACA instructor, you might think that I value data above all else but I actually agree with the two speakers.
At WACA, we believe that all consulting engagements should start from a business analysis because only by understanding the business goals will we understand how to add value with our data analysis.
Going back to the spinach, if you understand your client business well, finding the “spinach” in your business becomes a lot easier. And going back to bridging the gap between marketers and technology, understanding the business goals will drive the narrative of your data story.
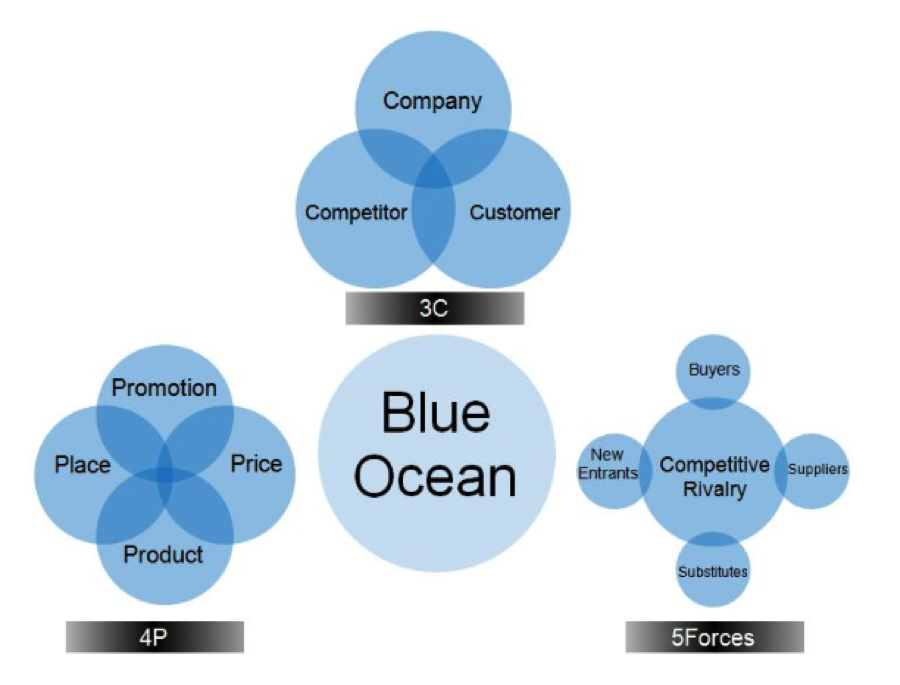
One of the frameworks we use to accomplish this is the 3C’s model.

The framework was designed based on the idea of MECE (mutually exclusive, collectively exhaustive) and will help you quickly identify your client’s competitive advantage in the market.
Once you’ve identified these areas, you will understand how to put the story together and how to use data meaningfully.
 Login as


;>/img/banner/partner $url=>$index; .png)