 Login as
To improve your online Rakuten shop, you’ll have to first put your assumptions on how to attract customers aside.
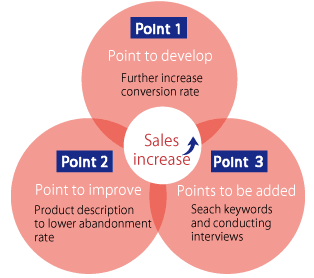
In this case study, we will show you how an online food shop in Rakuten Ichiba improved sales. This is the first of a three part series in which we discuss 3 key points:
- A method for increasing conversion rate
- Improving product descriptions that prevent customers from leaving
- How to conduct interviews and discover selling points through keyword research
Part 1: Increasing Conversion Rates Using The Analysis Tool of Rakuten Ichiba
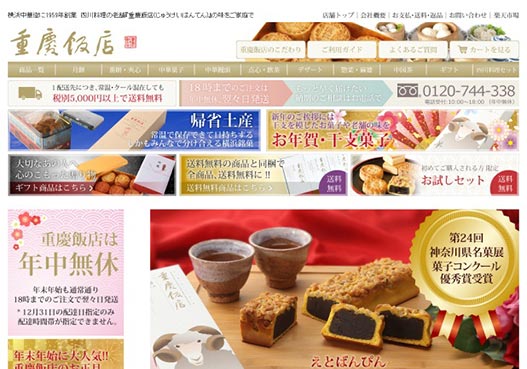
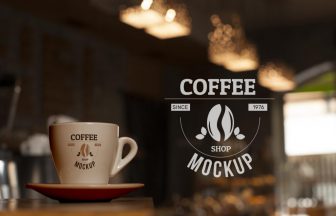
The image above is for the Jyukeihanten Chinese Restaurant. The main character for our case study today. We will show you how we improved their sales over a 3 month period.
Jyukeihanten is a Shichuan cuisine restaurant in Yokohama Chinatown. They have been in business for 56 years. Other than its actual store, they also have multiple online stores that handle about 200 different products. Their main products are Mabo tofu sauce, dim sum, Chinese tea, Yokohama rice cakes, moon-cakes, and other Chinese confectioneries. They have customers of all ages.
Their goal was to triple the annual sales from mail order purchases in three years. Jyukeihanten took the following measures in the first 3 months to start reaching their goal.
Point 1: Increasing the Conversion Rate
To identify the areas to improve in order to increase conversion rates, the entire website’s access analysis data was examined. The analysis showed that the main product page has a conversion rate of 7.6%. That’s a pretty decent conversion rate.
However, the problem was that there was no information on the details of the conversions. Were they repeat customers? Were there more female customers or male customers? This was data nobody had. Without knowing what sort of customers and which keywords led to conversions, we couldn’t develop a strategy to improve conversions.
Analysis – Examine Search Keywords, Customer Attributes and Hourly Access
Starting with an analysis of the search keywords, it was determined that keywords such as “jyukeihanten” and “product name” accounted for 47.71% of the overall result. We thought maybe these search terms could be from customers who already knew the products of Jyukeihanten or from those who were already interested in the products. Additionally, we found that several of those who converted were from repeat visitors, which would explain the high conversion rate.
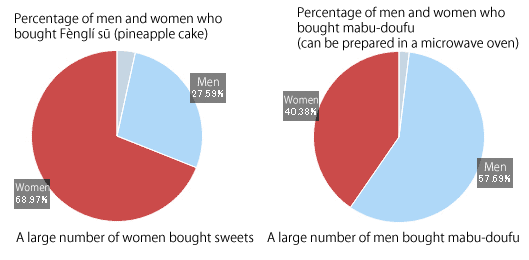
Further examining the customer attributes of customers who bought the main products, about 45% were male and about 55% were female, which was much less than our expectations. An interesting pattern here was that the ratio of female customers who bought sweets were much higher while the ratio of male customers who bought microwave ready products were higher.
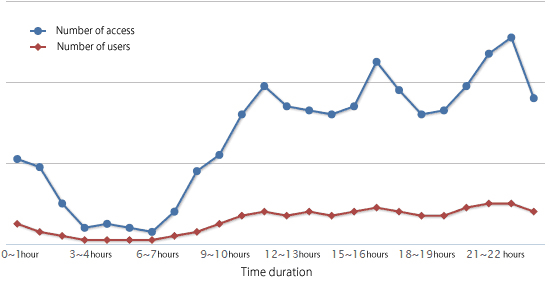
When looking at the hourly access, there was no significant difference in number of users between weekdays and weekends. This was an indication that there’s a wide range of potential customers.
At this point, we have to keep in mind that randomly increasing the number of access doesn’t make sense. If accesses don’t lead to a purchase, the conversion rate will decrease. With that said, to increase the conversion rates, there are two tasks.
Task 1. Consider adding the description “Pineapple cake” to the most popular product “Fènglí sū”
And so, I comprehensively examined common trend terms in Google trend, TV, radio and featured articles regarding food in order to increase incentives to buy. Jyukeihanten products that correspond to those trend terms are supplemented with product descriptions including keywords. At the same time, a banner aimed to bring in new customers was placed.
For example, imagine a store that specializes in pineapple cake was opened and was featured in a magazine and TV in Taiwan at the same time we implemented the measure. It just so happens that Jyukeihanten also handles pineapple cake products, but in Chinese, it is called “Fengli Su”. Since it was hard to realize that those two were the same product, adding the description “pineapple cake” helped prevent the loss of a user who was interested in pineapple cakes but didn’t know they were called “Fengli Su”.

Latest Taiwanese sweets craze (Pineapple cake)
In order to make sure repeat customers won’t be confused by the change, the package and current colors of the website were made uniform. We also kept some parts of the banner and made the transition as gradual as possible.
Task 2. Descriptions That Users Instinctively Understand
Since Mabo tofu sauce was popular with male customers, icons such as “Microwave oven Ok” and “10 pieces” were added to the product image. This allows our male customers to quickly identify products that are microwave ready since our analysis showed that males favor this feature.
Additionally, users who click through to the product page can easily visualize the actual preparation of the product with easy to understand food preparation descriptions.
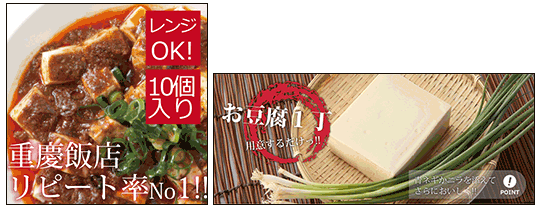
Left: Displayed in the Rakuten Ichiba search page
Right: Displayed in the product page
Result: Increases in conversion rate and achieved increased access rates
Adding appropriate product description and icons to popular products easily helped attract new customers with high potential value. Of course, visuals and details in the product page that made it easy to visualize the preparations helped greatly also. As discussed below. it is important to devise ways that won’t confuse repeat customers but at the same time, making improvements to make placing orders easy to prevent customers from withdrawing.
Below is a per product scatter plot of conversions which can be obtained at Rakuten RMS. The plot color shows the difference in products and the plot size shows the sales amount.
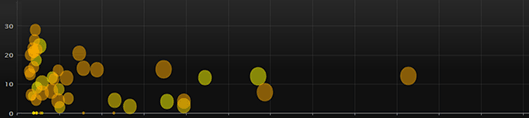
November 2013 X= number of access
Y= conversion rate
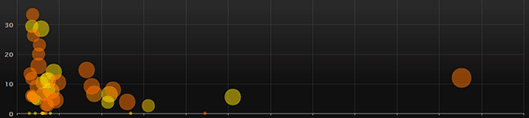
November 2014 X= increase in number of access
Y= almost kept the same conversion rate
——————-
…to be continued in “Part 2: Improving Product Descriptions”
- Part 1: Increasing the Conversion Rate
- Part 2: Improving Product Descriptions
- Part 3: Conducting Interviews & Keyword Research
Author of the original article:

Akiko Gotoh
Webmo Co., Ltd. Director
I’m from Mie Prefecture and graduated from Nippon University with a bachelor’s degree in Environmental science. I founded my own company while still in college. Through the apparel industry in May 2008, I found my way to web system development and established Webmo Co., Ltd.
Based on my experiences, I’m competent at system design taking into account the client’s specifications; I’m focused on not just building a system, but also building an online shop that sells, building an attractive online shop and building an e-commerce site that operates efficiently.


;>/img/banner/partner $url=>$index; .png)