 Login as
I am an absolute beginner to machine learning and i think this article will be very simple that people who just start in machine learning can understand what i am doing
i just start machine learning so i will apply all the concept that i have learn that relate to regression model,data cleaning,feature engineering in this project
+Importance library that will be use
import pandas as pd
import numpy as np
import matplotlib.pyplot as plt
%matplotlib inline
import seaborn as sns
+Load Data from csv file to dataFrame
df=pd.read_csv("../input/house-prices-advanced-regression-techniques/train.csv")
I have import pandas as pd so pd.read_csv(filepath) that mean i want to convert from a csv file to dataframe
+Exploring data
What i mean by exploring the data is i want to analyze all factor that affect the result also I want to know which column is more importance and which column i should remove from dataframe. Data cleaning and outlier removing also include in this process.
Now let list all the column of a dataframe
k=sorted(list(df.columns))
k
as we see there are 80 columns are indepandance variable and 1 depandance variable(SalePrice) in our DataFrame if we put all this columns into our model our model will not optimize because some of the columns may not determine the price so we need to remove it that will increase our model’s performance
To identified we which are the columns that we should use to train our model i recommend you to look this Notebook: https://www.kaggle.com/pmarcelino/comprehensive-data-exploration-with-python
after doing this i’ve seen some solumns that interesting
1.BsmtQual:it is the quality of the basement
2.TotalBsmt: Total square feet of basement area
3.1stFlrSF: First Floor square feet
4.2ndFlrSF: Second floor square feet
5.GrLivArea: Above grade (ground) living area square feet
6.GarageCars:Size of garage in car capacity
7 .KitchenAbvGr: Kitchens above grade
8.TotRmsAbvGrd: Total rooms above grade (does not include bathrooms)
9.MiscFeature : Miscellaneous feature not covered in other categories
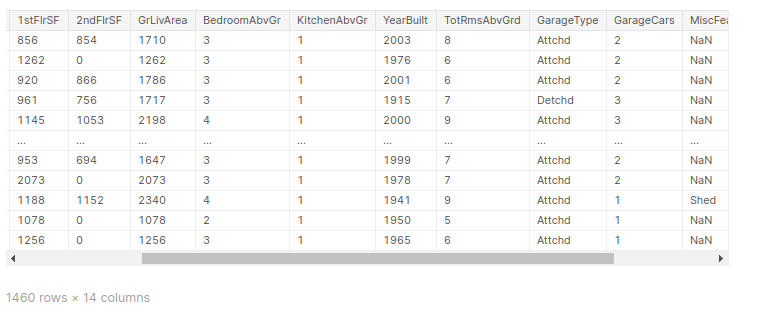
df1=df[["BsmtQual","TotalBsmtSF","1stFlrSF","2ndFlrSF","GrLivArea","BedroomAbvGr","KitchenAbvGr","YearBuilt","TotRmsAbvGrd","GarageType","GarageCars","MiscFeature","MiscVal","SalePrice"]]
df1
Now I removed all the column that i think it is not importance and only keep the column that i think they are impact the price. This our DataFrame
Data Cleaning and Feature Engineering
Data Cleaning
- Data cleaning refers to preparing the data for our model by removing or modify the data that not complete or irrelevant to our model
- It help in increasing the accuracy of our model
- Most of the time, almost 80% in modeling process is dedicate to data cleaning
Feature Engineering
- it is the way we apply our domain knowledge or business knowledge about the data to remove outlier or erorr data. ex: if we know that a room in a house is maximum 300 square feet but in the data is more than that so we will remove from the dataframe
- it is also include in data cleaning
Now let see How much data we have:
df1.shape[0]
Now let see How many row that has null value
df1[df1["MiscFeature"].isna()].shape[0
As we see there are a small amount(1406) of data that has Miscellaneous feature so we can consider it as outlier then remove them from our dataframe the increase our model performance
df3=df2.drop(["MiscFeature","MiscVal"],axis="columns"
+Remove outlier
df3.SalePrice.describe()
Output:
count      1406.000000
mean     182046.410384
std       80084.136570
min       34900.000000
25%      130000.000000
50%      164250.000000
75%      215000.000000
max      755000.000000
Name: SalePrice, dtype: float64
df3["price_per_sqt"]=df3.SalePrice/df3.GrLivArea

df3.price_per_sqt.describe()
Output
count    1406.000000
mean      120.947425
std        31.538984
min        28.358738
25%       100.332272
50%       120.344258
75%       139.045487
max       276.250881
Name: price_per_sqt, dtype: float64
+Visualization
- it is very importance because as we are human picture get us to understand thing very qucikly
- For me i think data visualization is like memes
- “if we need to explain our visualization that mean our visualization is not good enough”
To make clear that those columns have a strong affect on the saleprice i am going to visualize those columns with sale price
In [15]:
def year_price(df):
    plt.scatter(df.YearBuilt,df.price_per_sqt)
    plt.xlabel("YearBuilt")
    plt.ylabel("Price_per_sqft")
    plt.legend()
it seem that year built and price has a positive relationship
now let see the graph
    plt.scatter(df3.TotalBsmtSF,df3.price_per_sqt)
    plt.xlabel("Total basement area")
    plt.ylabel("Price_per_sqft")
    plt.rcParams["figure.figsize"] = (15, 10)
    plt.legend()
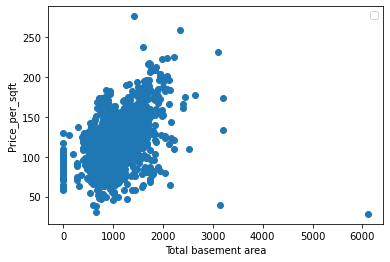
As we see in the graph there are some outlier so we need to remove it to increase our model performance
import numpy as np
def remove_out(df):
    remove_data=pd.DataFrame()
    for year,year_df in df.groupby("YearBuilt"):
        m=np.mean(year_df.price_per_sqt)
        s=np.std(year_df.price_per_sqt)
        out=year_df[(year_df.price_per_sqt>(m-s)) & (year_df.price_per_sqt<(m+s))]
        remove_data=pd.concat([remove_data,out],ignore_index=True)
    return remove_data
df4=remove_out(df3)
df4


;>/img/banner/partner $url=>$index; .png)