 Login as
Hi, everyone. This is Nozomu Kubota, Representative at Creators NEXT Co., Ltd., which provides a web analytics tool named “KOBIT.” As I was solicited to contribute to the Web Analytics Consultants Association (WACA), I am going to write about reporting, with which many of you often have difficulties, and show you the reports that I created from the WACA website data on Google Analytics by using KOBIT.
[toc]Tell Me About It #1: My clients’ expectations get higher every month.

“I want to please my clients with my analytic ability while I can.” The more you think this way, the further you will analyze, expanding the scope of analysis.
Many of you probably had difficulties creating a final report for the Senior Web Analytics Consultant exam. The report requires you to research 20+ pages of items by yourself, create graphs from the obtained data, and export the data to PowerPoint for analysis. This difficult training let you familiarize yourself with every detail of your tool, but many people must have thought that they would not want to do it ever again.
Even so, if you work your tails off to help your client, you only raise their expectations and end up needing to maintain the quality every month.
Dear web analytics consultants who desperately continue analyzing under the silent pressure every month (including myself… (grin)),
What a pitiful scene that is!
Tell Me About It #2: Some questions are always left somewhere because web analytics consultants cannot answer them alone.

“I don’t know why, but the access always rises on Tuesdays.”
“Referrals from an unfamiliar corporate web page bring in an exceptional conversion rate. Is this company one of the client’s acquaintances?”
Such questions always leave you wondering as you cannot get the answer through online analysis alone. When I encounter a question like this, I get excited about “getting close to the key to facts.” There is a limit to online analysis; you may be able to see the figures but unable to see the reasons behind them.
For example, the reason for the spike in access may be that your client distributes flyers on Tuesdays. I have frequently experienced incidents where things I could not understand while online could be easily understood by hearing from my client, and I found out the client’s true strengths while I was listening.
There was a case where a flyer had an astoundingly appealing advertising copy, but the copy was not in-line with the messages on the web page. Unless you coordinate your brand messages between the website and flyer, those who had become interested may leave, thinking, “Hm? Something is wrong here.” Therefore, web analytics consultants need to create reports based on their online and offline activities.
Tell Me About It #3: Your time is taken up by miscellaneous tasks other than analysis.

What web analytics consultants truly want to do is analyze, but in real life, you might be forced to do tasks unrelated to analysis.
Work related to documentation comes at the top of such a task list. For example, you first download data from Google Analytics in a CSV file, and you will manipulate the data into a visually-appealing, formatted report on PowerPoint. This kind of work is surprisingly labor-intensive.
I can’t even remember how many times my PowerPoint has hung just before I have completed a report, leaving me no other option but to reboot it with tears in my eyes. What a sorrowful incident; I could only compose a senryu poem, “Reboot’n PowerPoint, O, I am at my wit’s end, with my will disjoint.” Of course, it’s well into midnight when I anxiously mumble to myself, “Holy God, please let my work be somewhere… When did I save it last?” I am beyond my physical and mental capacity. Meetings with clients are always first thing in the morning. Energy drinks and coffee are the only friends in those times.
As you see, it is not easy. On top of it, I tend to make calculation mistakes on my documents because I work in such a state.
Analysis requires unflagging effort. While making the unflagging effort, one piece of calculation error may sometimes violently shake your hypothesis. During the Web Analytics Consultant course, the issue of “faulty data” is discussed, but it is not someone else’s affair; it is your own.
“Gosh, I need to rethink from the start…”
Haven’t you had such an experience?
Tell Me About It #4: Reports are demanded while KPIs are not determined.

Less frequently but sometimes, I am asked to provide a report before KPIs are determined.
I have had a few clients who said, “I want to raise my conversion rate, but my name recognition must be expanded as well. What? Conversion settings? I haven’t done them yet, so I will leave them up to you.”
When that happens, we, the web analytics consultants, are in trouble.
Web analytics consultants do not simply work on the analysis presented to us, but rather, we start our analysis from a bigger scope of business analysis.
Because we begin our analyses by defining the website to make its optimal contribution to the company, unless the corporate goal is decided, the direction for analysis will widely blur.
If raising the conversion rate is the corporate goal, it is important to improve the landing pages, which usually have the highest access count; it is easier to set the analytical direction in a case like this. However, you need to cover all bases when you create a report to grasp an overall situation, and the difficulties will rise. (Then, we end up going straight to “Tell Me About It #1” above.)
Tell Me About It #5: You tend to report different metrics every month.

You often report different metrics from month to month.
For instance, the figures on the reports (such as regional analysis) do not vary much from one month to another. The accesses are mostly in sync with the population, so after taking a glance, you may wash your hands by talking with your client without adding it to your documented report.
The cause of the issue is setting a non-volatile metric as a reporting KPI in the first place, but it is quite difficult to take it back once you have promised to your client.
Furthermore, when you have limited choices in reporting metrics because of the small data volume, you would rush in wanting to propose a new metric badly enough to analyze something new, leading yourself to lose sight of your direction, as well as confuse your client.
That creates a problem. Reporting has its significance also in the fixed-point observation. Even similar figures are displayed, unless you report the fact that regularly, you will miss a bigger change when it occurs.
Where does the significance lie for a web analytics consultant to be paid?
Now, from this point forward, I am going to discuss the situation described above from client’s staff viewpoint.
Their only wishes are to learn the expert knowledge only a web analytics consultant can provide and to obtain solutions for increasing the name recognition or sales of the company. They neither want you to work overtime until midnight nor appreciate your report as a supreme object just because it was created as a product of tears and caffeine.
In spite of what has been said, the staff are not necessarily working alone, so it is not that the report is unnecessary. They think that they want a proper report from which their superiors and team members can see the current status and use it as a guide to know what to do next. Inefficient and misdirected reports would be considered meaningless, and the subscription to outsourced reports may be terminated.
They need proper reports and proper answers.
To realize the two needs of your client in a report, it is more constructive to make reporting efficient by using tools rather than a web analytics consultant making a tear-inducing effort.
What if the elves create a report for you while you are asleep at night?
KOBIT, which we offer, was born out of the concept of “Let the elves do the report generation and make analysis efficient,” for those who are struggling to create reports.
KOBIT is a service that automates report generation using Google Analytics just like the elves in “The Elves and the Shoemaker” by Brothers Grimm. A report that usually requires three days is automatically completed in about one minute.
Furthermore,
- Editing is a breeze because the generated report comes in a PowerPoint format.
- No new tag is necessary as long as a Google Analytics tracking code is placed.
- All of this is just 5,000 yen a month (tax excluded).
Therefore, it is easy to introduce it into your work. KOBIT will enable you to propose a better improvement idea because report generation is made efficient by relieving all of the side work that web analytics consultants shouldn’t do, and by presenting reports in a PowerPoint format, the consultants can easily add their own views.
It is also convenient because the reports are created from a fixed point every month, so the more you repeat, the more records you can accumulate as archives.
Let’s create a final report for the Senior Web Analytics Consultant Exam.
There was an assignment in a Senior Web Analytics Consultant Exam to create a report and come up with advice based on the WACA website’s Google Analytics data. I used KOBIT to create the report.
User Analysis
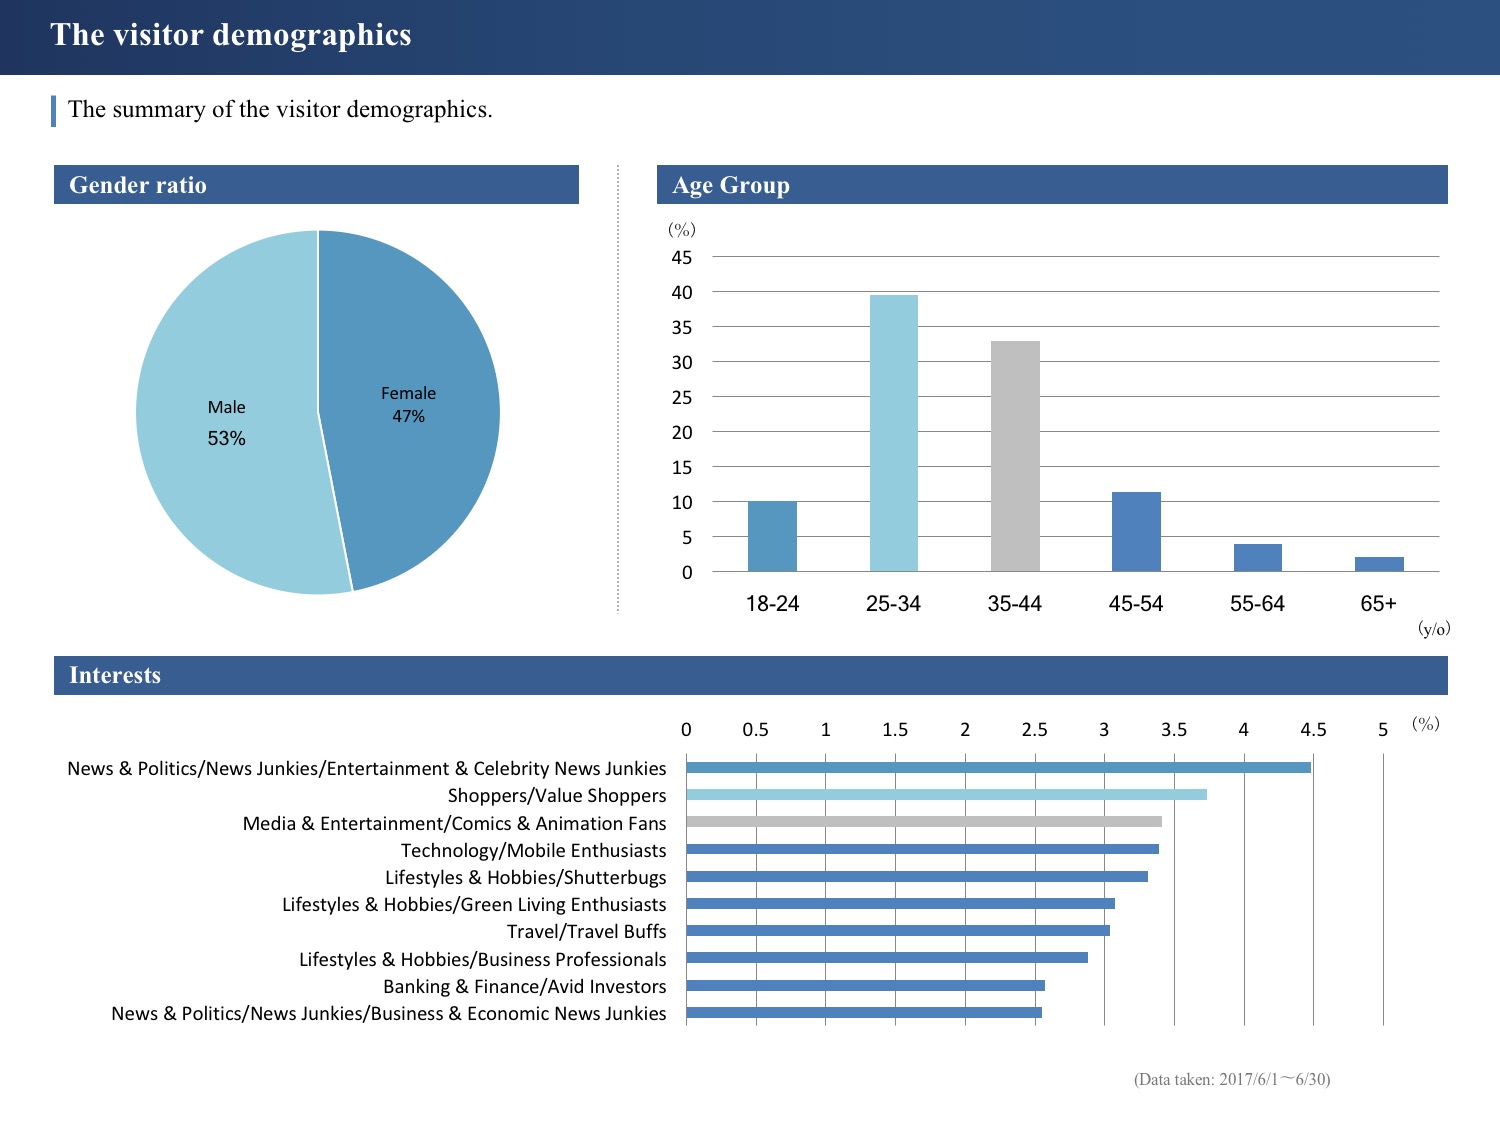
First, this is a user attributes analysis. Comparing men and women, the number of accesses by men is slightly higher, while the age ranges are mainly 25-34 and 35-44. Also, the WACA website is not a site that the users who visited the site usually view, so there is a possibility that they also view other sites.
In the column entitled “What the visitors are interested in,” are trends in sites other than WACA’s that the viewers visited. In this example, we can see a trend towards “shopping lovers/price-centric.” To target this audience, it might be necessary to show your prices clearly or devise a way to show that your prices are low compared to those of your competitors because the audience will check the prices thoroughly.
In such a case, it is better to employ a method of comparing apples and oranges. Instead of comparing similar web-related qualifications, it is better to compare WACA’s services to something totally different.
To give an example, if you say that your oranges are cheaper than those elsewhere, shoppers will assume, “Oranges elsewhere might be tastier or nutritionally superior,” and they will consequently tend to buy oranges elsewhere.
Meanwhile, suppose you say that you recommend your customers and their entire family eat oranges that contain ample water and potassium to avoid summer fatigue; the target of the comparison quickly changes to familial health. It is easier to hit the mark if you compare the price of your oranges with a family’s health than with those of your competitors.
The prices presented by WACA on its website will be more readily accepted by viewers if the prices are compared with the loss from not improving viewers’ websites than with those of WACA competitors.
Analysis by date, day of the week, or hour of a day
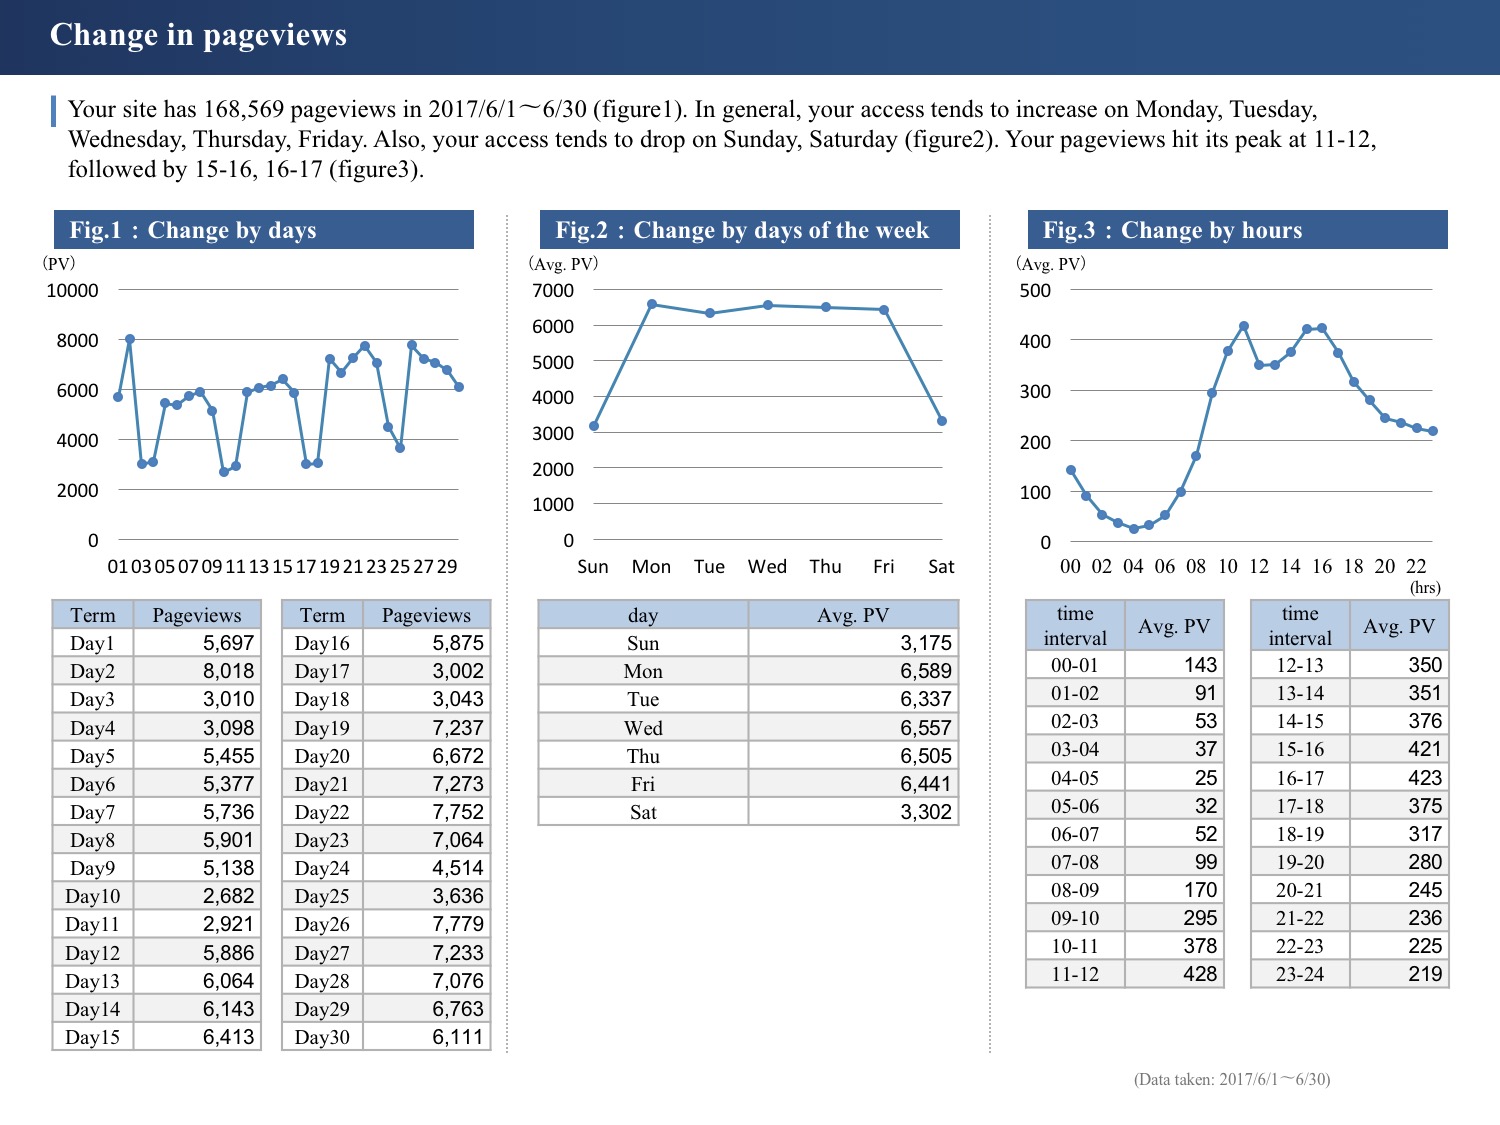
Next, the data was analyzed by date, day of the week, and hour of a day. It is wonderful to see the result of the access increasing by 32%. Only WACA could achieve such a result. The actual access count is sufficient.
You can often see a decrease in access on weekends as the trend in B2B sites. The access hours usually match with office hours as well. For B2C websites, the access is usually concentrated during the morning commuting hours or after work, but the WACA site is viewed in the middle of weekdays, so we can assume that there are many accesses from working people.
Thus, the lifestyle of visiting users gradually emerges, and the accuracy of your hypothesis naturally increases.
Referrer Analysis
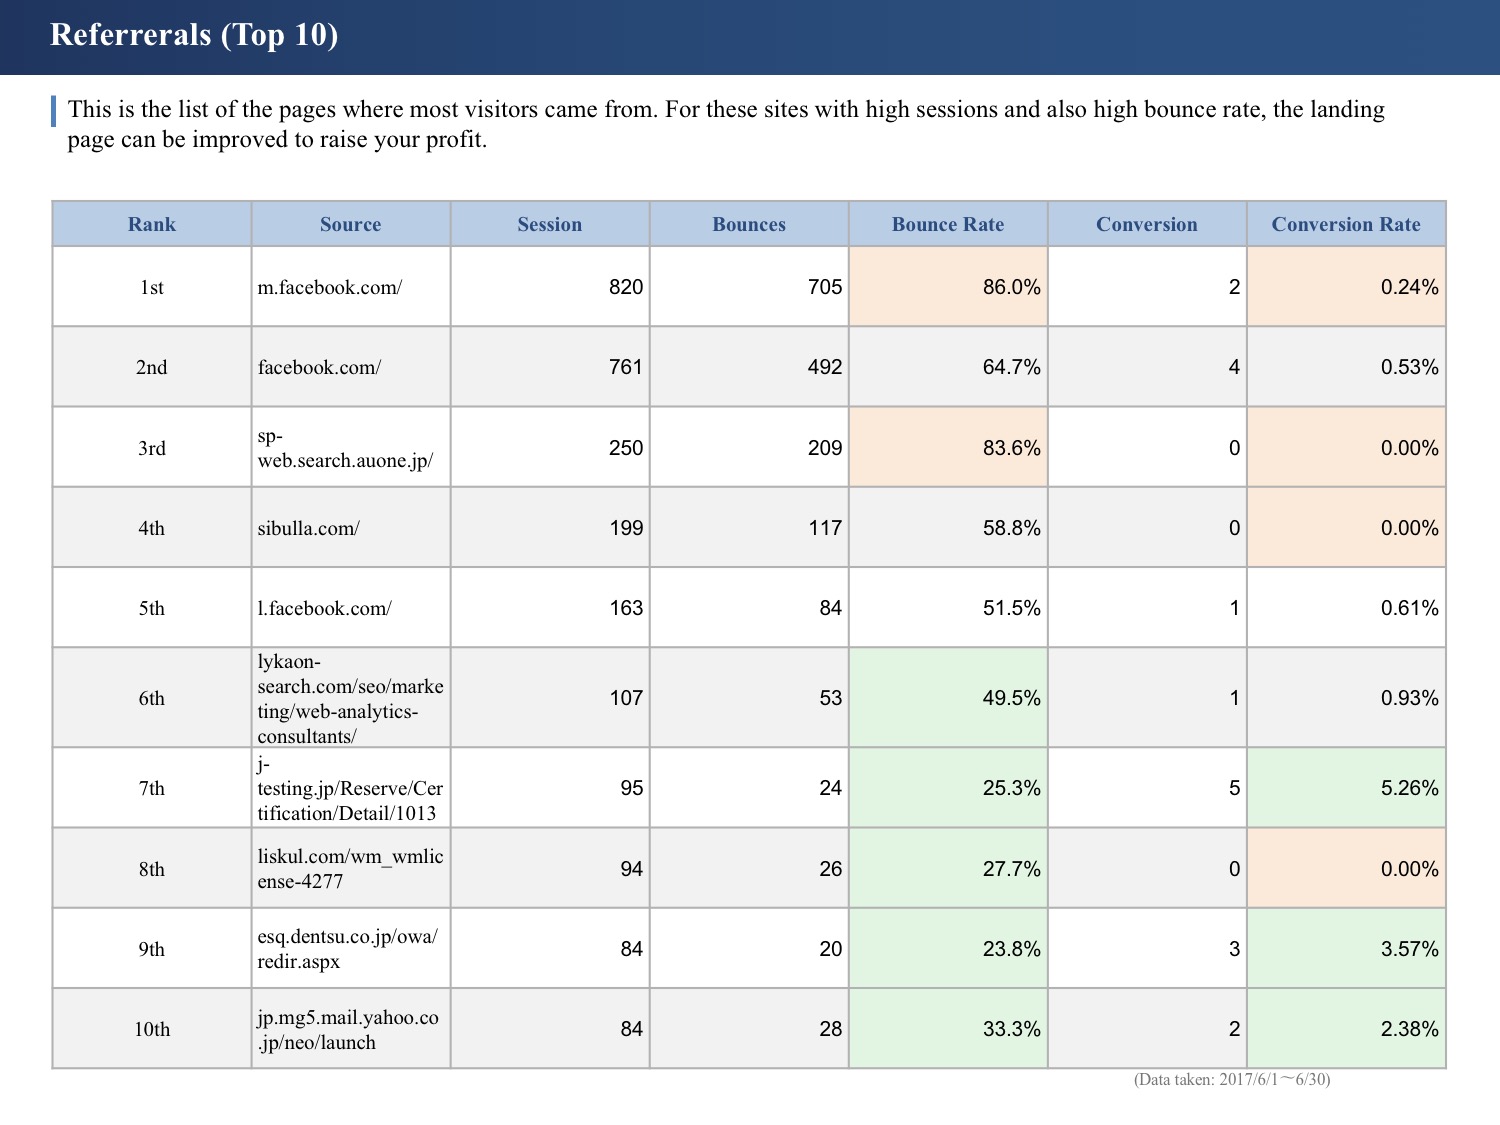
We can see an extremely outstanding referrer, the internal system of Dentsu Inc., in the report. There are three conversions out of 84 sessions, so the conversion rate is 3.57%. This figure is very high.
We can understand this because the qualification of Web Analytics Consultant is widely recognized among advertising agencies, so they apply for WACA certification programs. However, if you do not know something, you can ask your client what caused the inflow and come up with other links and referral possibilities.
Also, you can think about how to inform the facts and figures inside a client company. If you think about a reproducible method that can be applied to other companies, you may research how to better inform your client as a whole.
Users’ Viewing Location
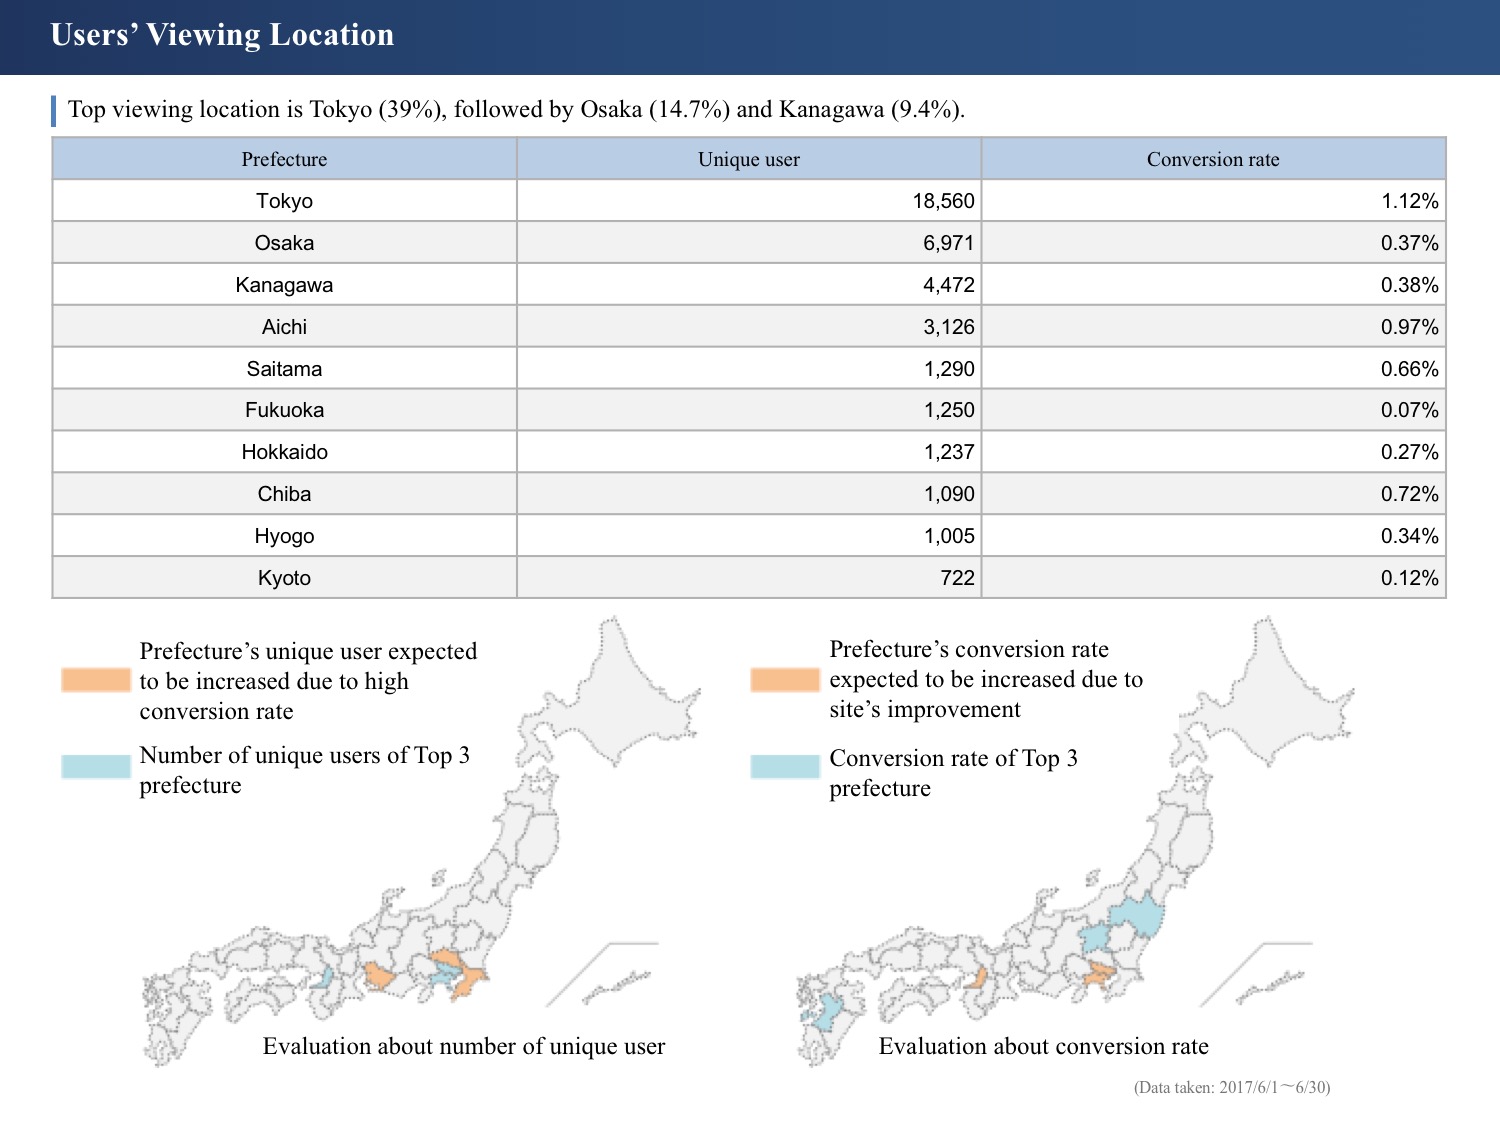
We will look at viewing location data. The conversion rate in Tokyo is 1.12% and very good, but those of the runners-up Osaka and Kanagawa are 0.37-0.38% and low.
We first guess the reason might be that the programs are not offered frequently enough, or not offered at all; then, go and look at the website itself.
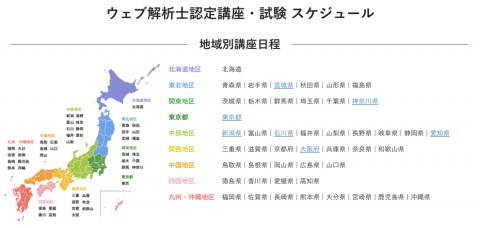
Unexpectedly, the programs are offered in Osaka and Kanagawa. Despite this fact, the conversion rates are lower than that of Tokyo. Your question deepens. Do you remember what I said at the top? Yes, this is the key close to the facts.
If you analyze further, you can find the conversion rate in Saitama is 0.66%, although no programs are offered in the prefecture. That means: The conversion rates in Osaka and Kanagawa, where the programs are offered, are 0.33%. The conversion rate in Saitama, where the programs are not offered, is 0.66%. In Tokyo, the rate is 1.12%.
Something strange is apparently happening. This is the type of question that I personally consider important.
Most of the time, when I find this type of question, I jot it down and ask my client while I am presenting the documentation at a later date.
It is a good idea to ask, “There are considerable gaps among the conversion rates in Osaka, Kanagawa, Tokyo, and Saitama; what do you think is the cause? Are there any differences in the characteristics of offered classes?”
If you do, you may be able to know the regional attributes or reasons that you did not even imagine.
New and Returning Visitors
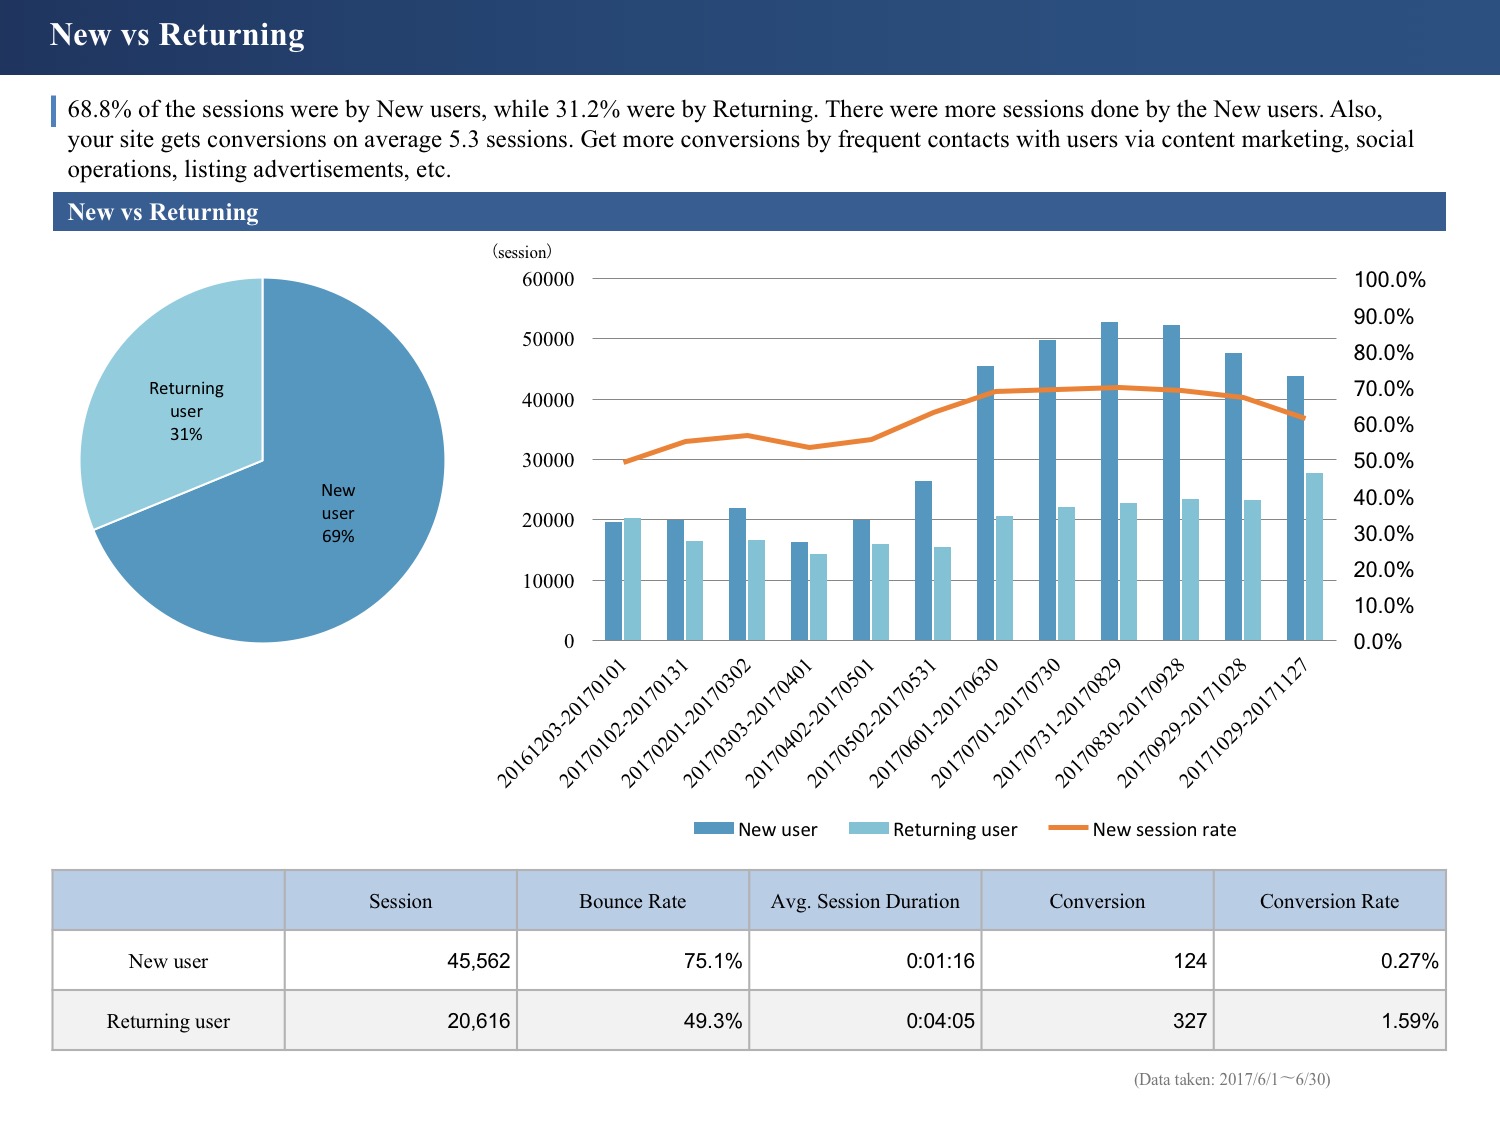
A comparison between new and returning users is made. You can tell that the number of new visitors is sharply increasing. The new session rate is growing from below 60% to just about 70%. You can guess that the company initiated some campaigns. I would make a memo because I want to ask my client about this later.
You will be able to understand your client’s business model more deeply if you ask, “Did you initiate any campaign because the figures rose in June?”
Devices Used by Visitors
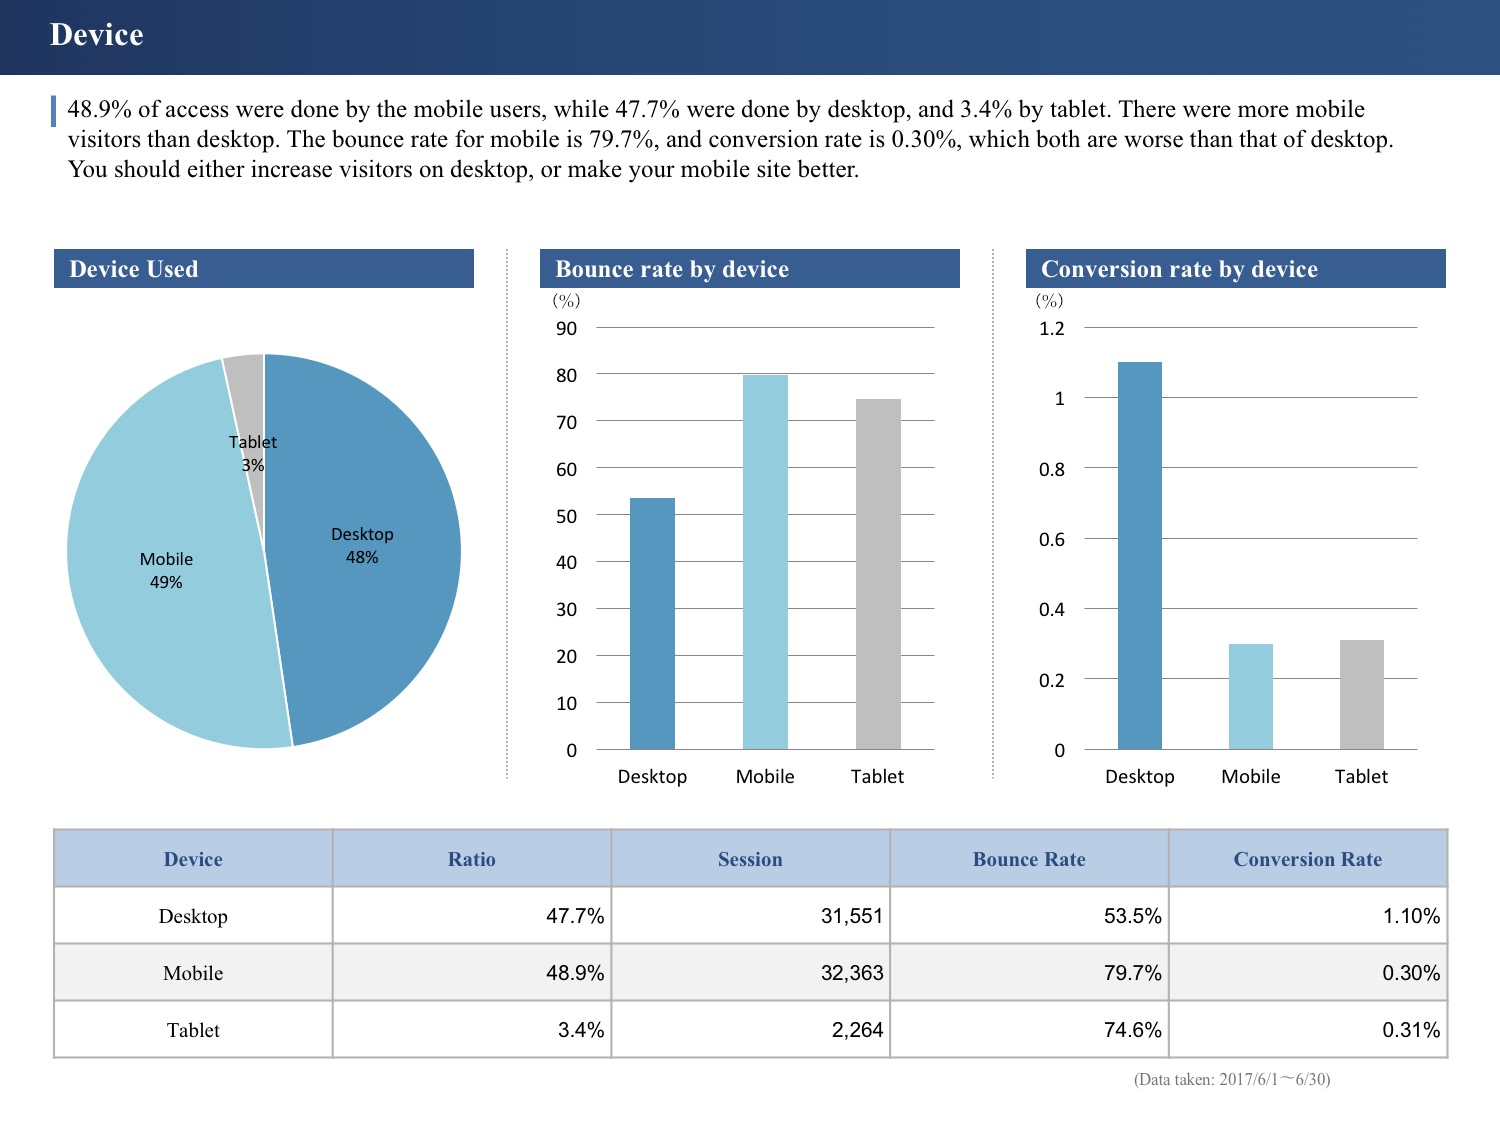
Now, we will analyze the data by the device. If we compare PCs, smartphones, and tablets, you can see that the conversion rate of PC is high, and that of smartphone is low.
In spite of access by smartphone being higher than by PC, the smartphone conversion rate is one-third that of PC, which may mean that there are some issues behind it. You can sometimes solve this type of mystery by digging into Google Analytics.
We will filter the data to mobile and tablet users only and compare their attributes first. Do you see any difference between mobile/tablet users and PC users?
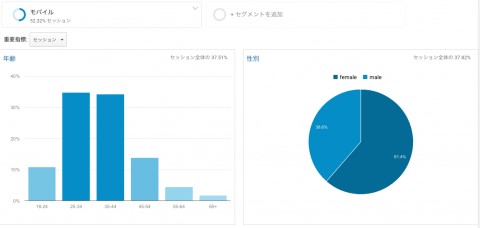
From the mobile user data, you can tell that the rate of access by women is higher. You can also see that the access from the age range 35-44 is increasing. From there, we will compare the conversion rates within the mobile/tablet users.
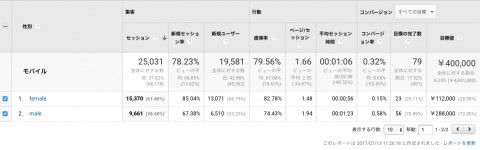
The conversion rate for women is 0.15% whereas that for men is 0.58%; there is a four-times difference between women and men, and the majority of visitors using a mobile/tablet device are women.
Now that we know that the women who access the site on smartphones do not convert, we will apply an in-depth analysis. You can hypothesize that the current women’s conversion count of 23 could increase by as many as four times if we bring the women’s conversion rate up to that of the men’s 0.58% level by inviting several women marketing staff to discuss the causes of non-conversion under the current state of the site to find clues.
We will dig even deeper.
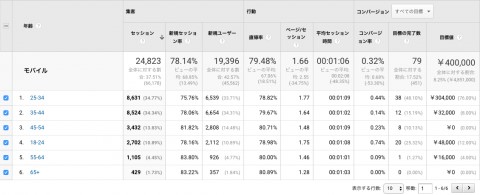
I analyzed the age ranges of those who converted on mobile devices. When we look at this data, we can see that most of those who use mobiles are in the 25-34 and 35-44 age ranges. With this result, we will compare the two ranges.
The conversion rate for the age range 25-34 is 0.44%, whereas that of 35-44 is 0.14%. The conversion rates differ by a factor of three. Moreover, that of the age range 18-24 is 0.74% and high, and that of 45-54 is 0.23%. We find that the older, the lower, and the younger, the higher are the conversion rates.
You need to know smartphone-specific operations, so whether one uses a smartphone on a daily basis or not will affect one’s sense of operability. A typical example of these specific operations is a hamburger menu button.
A hamburger button is a user interface icon that consists of three horizontal parallel lines and is used on Facebook and other sites.
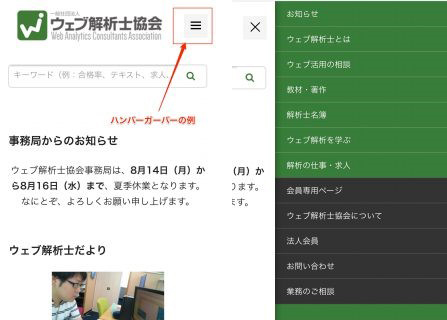
WACA’s smartphone site uses this hamburger button. If you click on it, a menu appears in a flash. Let’s try.
The result is shown above. This icon is very useful and convenient once you get used to it, but as someone put it in the title of a LinkedIn article, “The Hamburger is dead. Long live the Hamburger,” I hear opinions saying, as well as “Might it bring down the conversion rate?” more often recently. A hamburger button requires one tap on the icon and another one on the menu item, forcing users two to tap twice, so it is an interface that assumes the users already know how it works.
This discussion could go deeper, so for now, I will simply show you the following three cases concerning a hamburger icon.
Japanese content Reference: Three Business Cases Where Alternatives are Employed by Replacing a Hamburger Button that Causes Low Click Rates on Smartphone Sites — KOBIT
Summing up, we confirmed the two trends regarding smartphone and tablet users that the younger, the higher, and the older, the lower is the conversion rate, and that more men than women convert.
To improve this status, we need to come up with a better interface that even those who are unfamiliar with smartphone site operations can use, and we need to alter the designs of sites make them more acceptable to women.
In a time like this, it is effective to look at the interfaces of several famous sites offering women’s qualification/certification programs in different fields. For example, why don’t we take a peek at the preschool teaching certification page on “ユーキャン (You Can)” site?
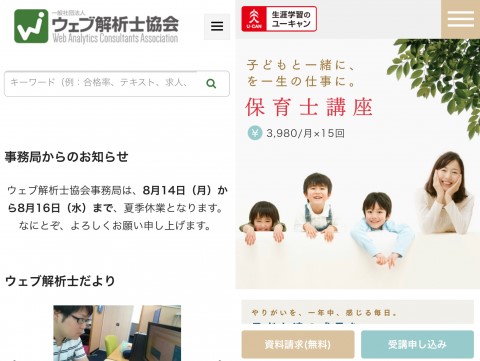
A comparison of the first views of the “You Can” and WACA sites shows us just how different the pages look. Given such a contrast, we can understand the low conversion rate of women on the WACA site.
Inflow Source Analysis
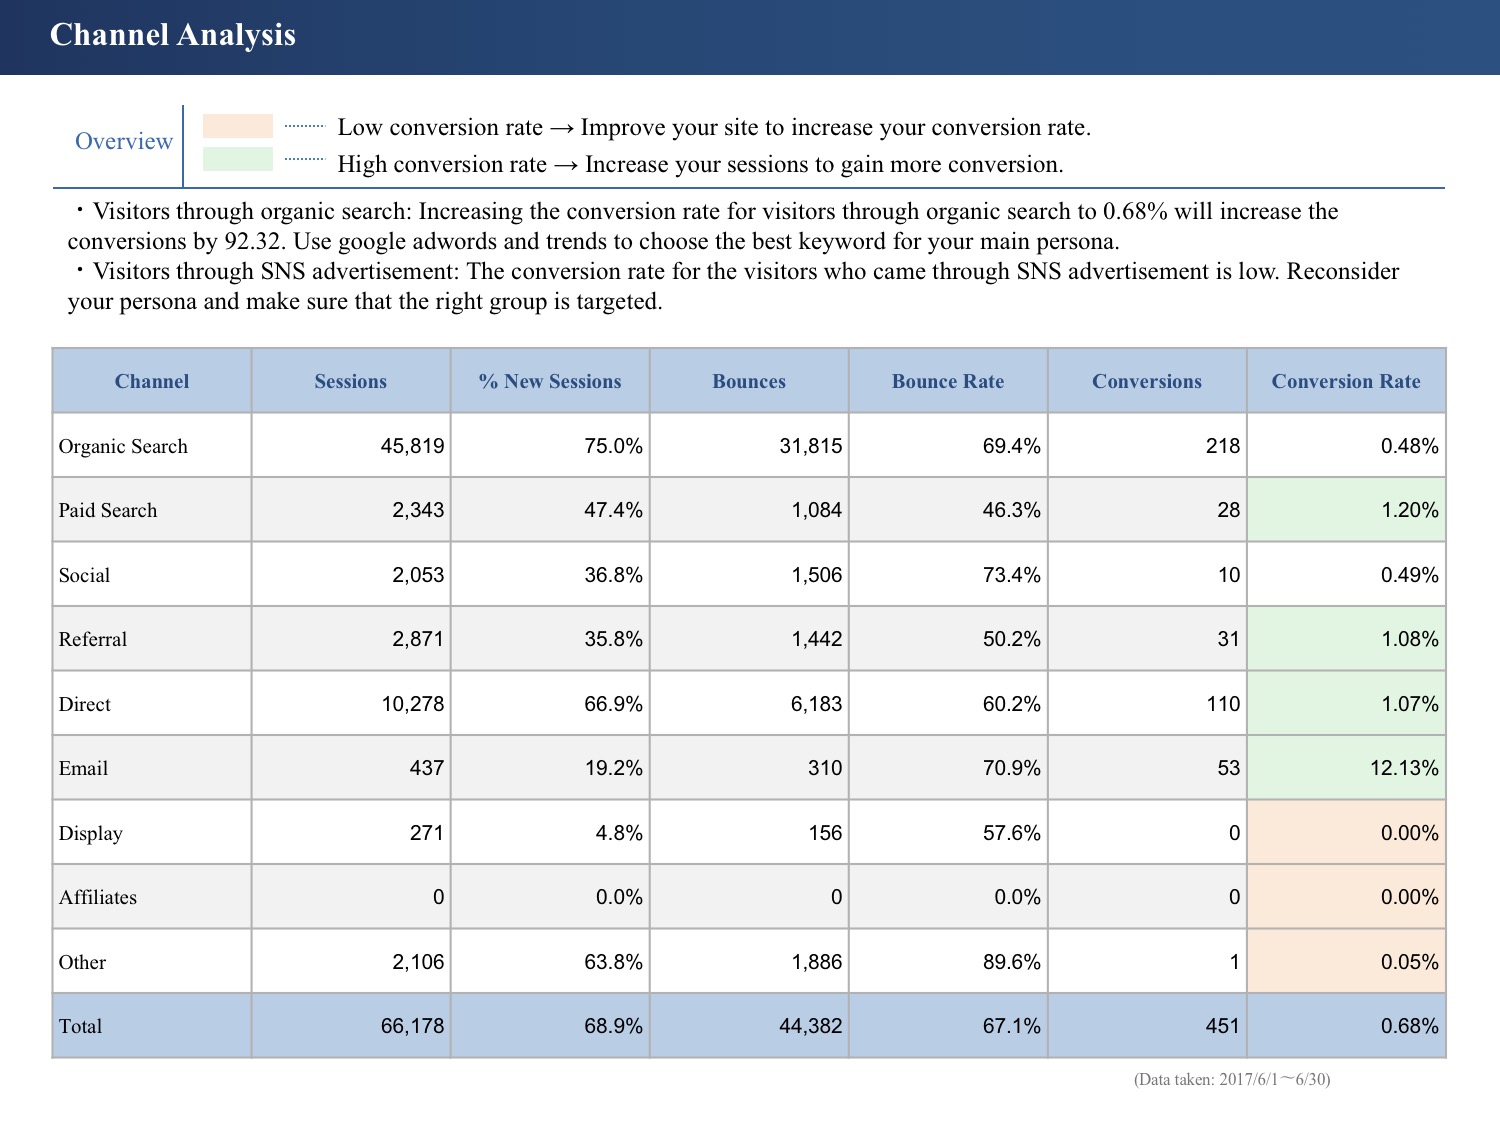
We will move on to inflow analysis. The analysis is done by the channel. You can tell that the conversion rate by ads is extremely high compared with the rest. I can assume that various paths must have been identified already as to how to obtain the most conversions with what types of ads and what keywords.
If that is the case, you can think of an idea for a content marketing campaign using the identified keywords. If you can obtain as many conversions from the organic inflow as you can from the paid inflow, you can lower the costs of attracting customers.
Then, what keywords are selling the most? Let’s go back to Google Analytics and consider this.
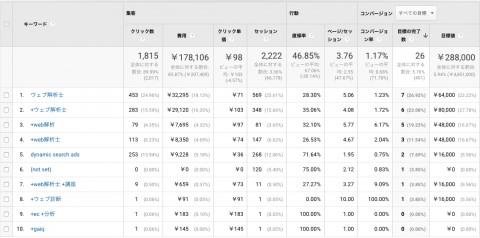
The keyword “ウェブ解析士 (web analytics consultant)” brings in the most conversions. Out of the 26 conversions brought in by search ads in June, 22 were related to the keywords “web analytics consultant.” That means that the website is probably displayed close to the top already with those keywords related to Web Analytics Consultant; so, we can see that a campaign using other keywords comes as a priority.
By going a step further, the site seems to not be displayed in a higher place by the keywords “dynamic search ads,” so an effective strategy to obtain conversions can be writing a series of articles concerning dynamic search ads and post them on the site.
Funnel Analysis
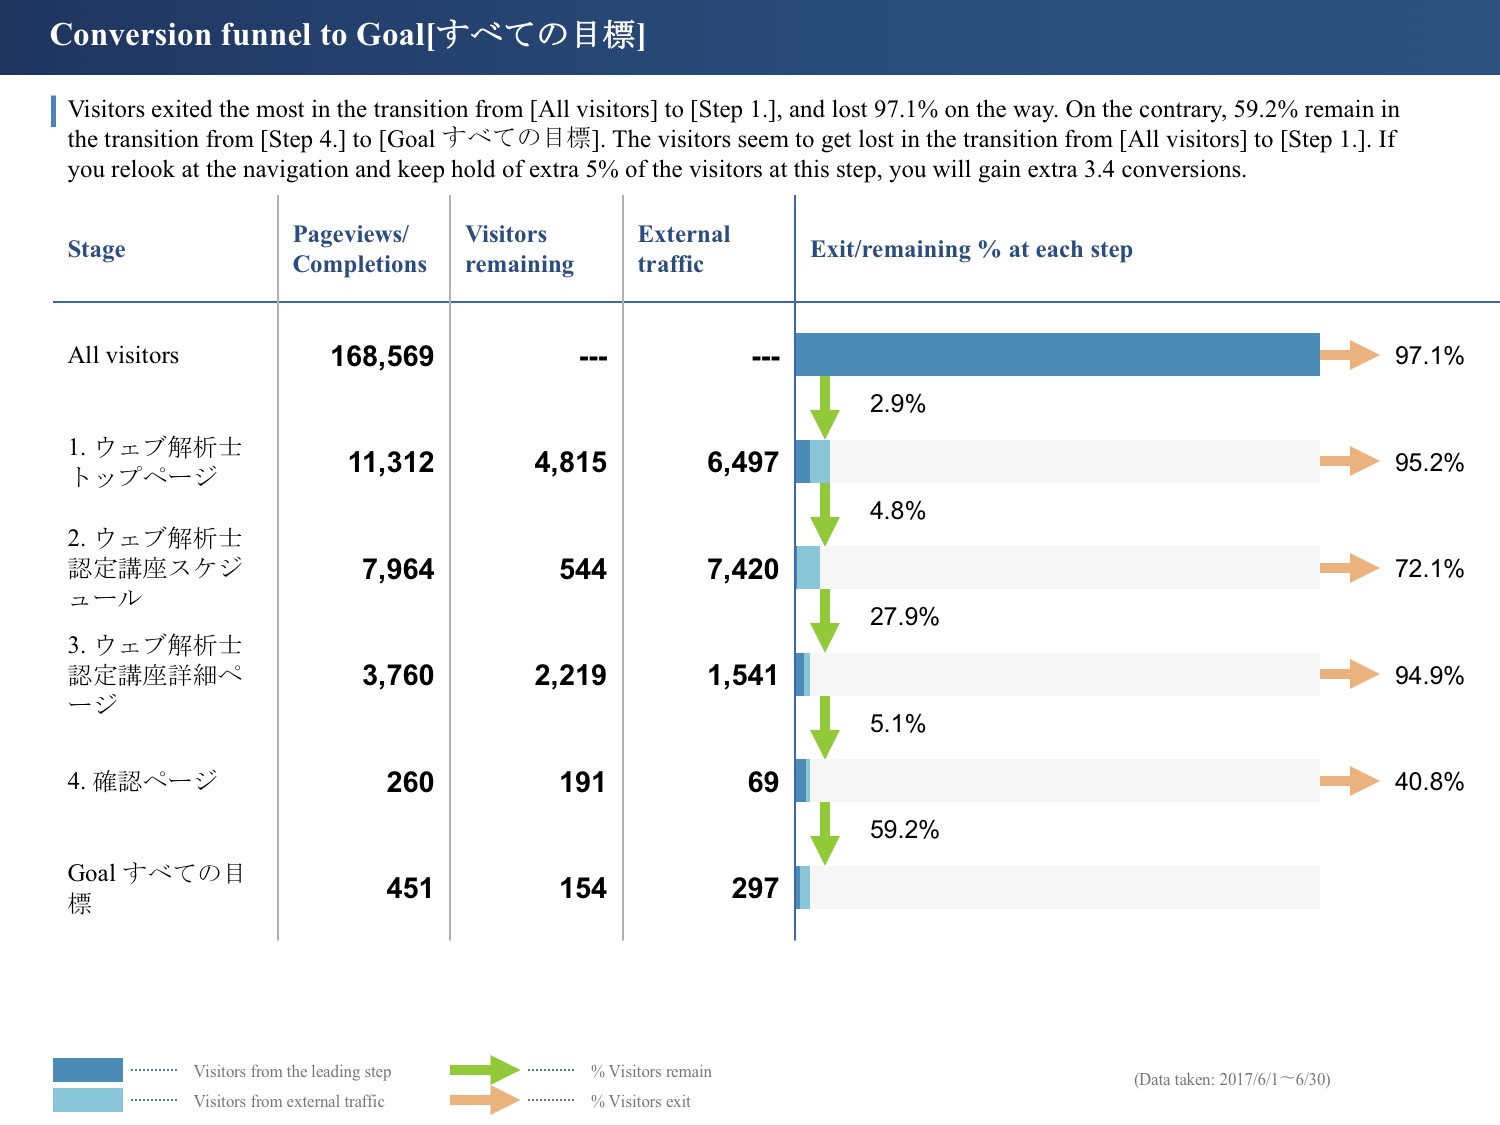
Let’s move on to the funnel analysis. With this analysis, you can find which pages you should revise by learning where users drop off the site. In this analysis, a scenario of the user flow is set as follows: users start at the home page, go to a schedule page, a details page, a confirmation page, and finish at a conversion page.
KOBIT can handle not only exact matches but also partial matches and regular expressions, so in a situation like this with multiple details pages, you can still set up a scenario to run a funnel analysis.
First, you can tell 95% of users drop off on the path from the home page to a schedule page. We can simply attribute the user exits to the two facts that a path leading to a schedule page is not clearly marked in a place that can be easily spotted, and that locating the page on the home page of the smartphone site is not possible.
What is even more unfortunate is the existence of a confirmation page. As you see, despite the fact that the users have mostly completed the application for courses already, inserting the confirmation page causes as many as 40.8% of users to drop it. It is possible for the conversion count to jump from 156 to 260 if the confirmation page is simply deleted. Needless to say, this is a measure that improves the cost performance because it does not take much labor to implement it.
Sales Calculation Sheet
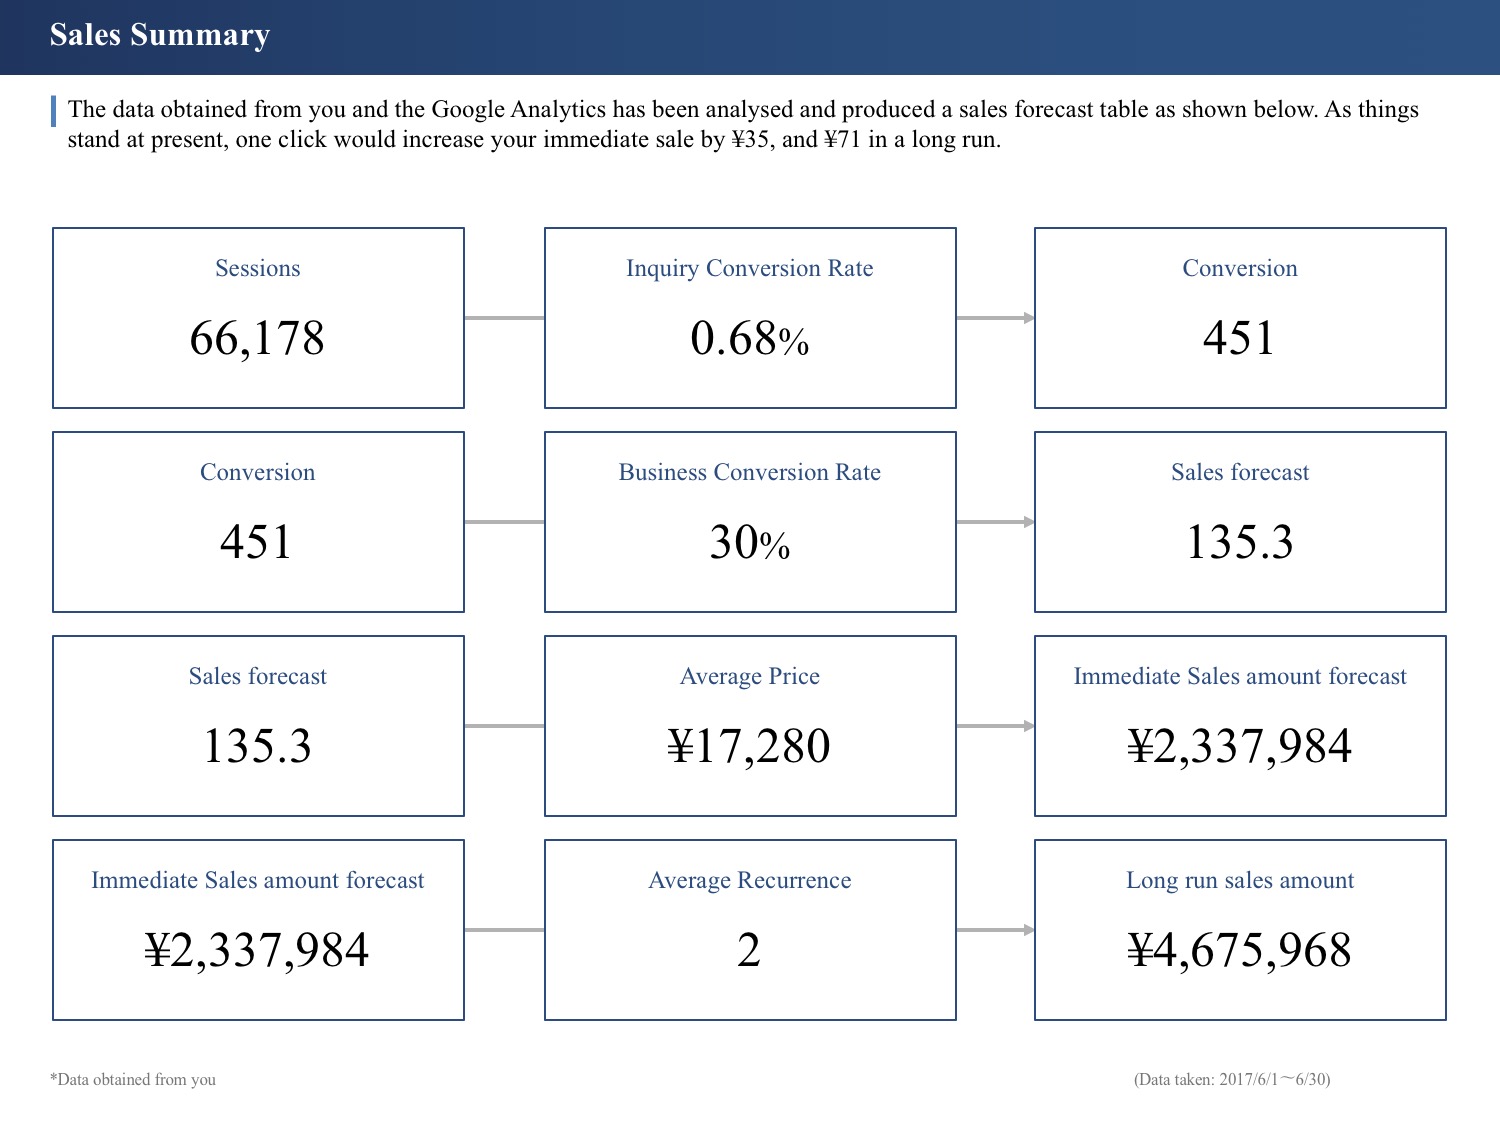
This is a sales calculation sheet. This sheet only shows this month’s net increase in addition to the previous total sales of the Web Analytics Consultant Course, so the actual revenue can be estimated much higher. This sheet helps you to think about the linkage between the business goal and the website’s goal by showing the sales amount with other figures.
Keyword Analysis
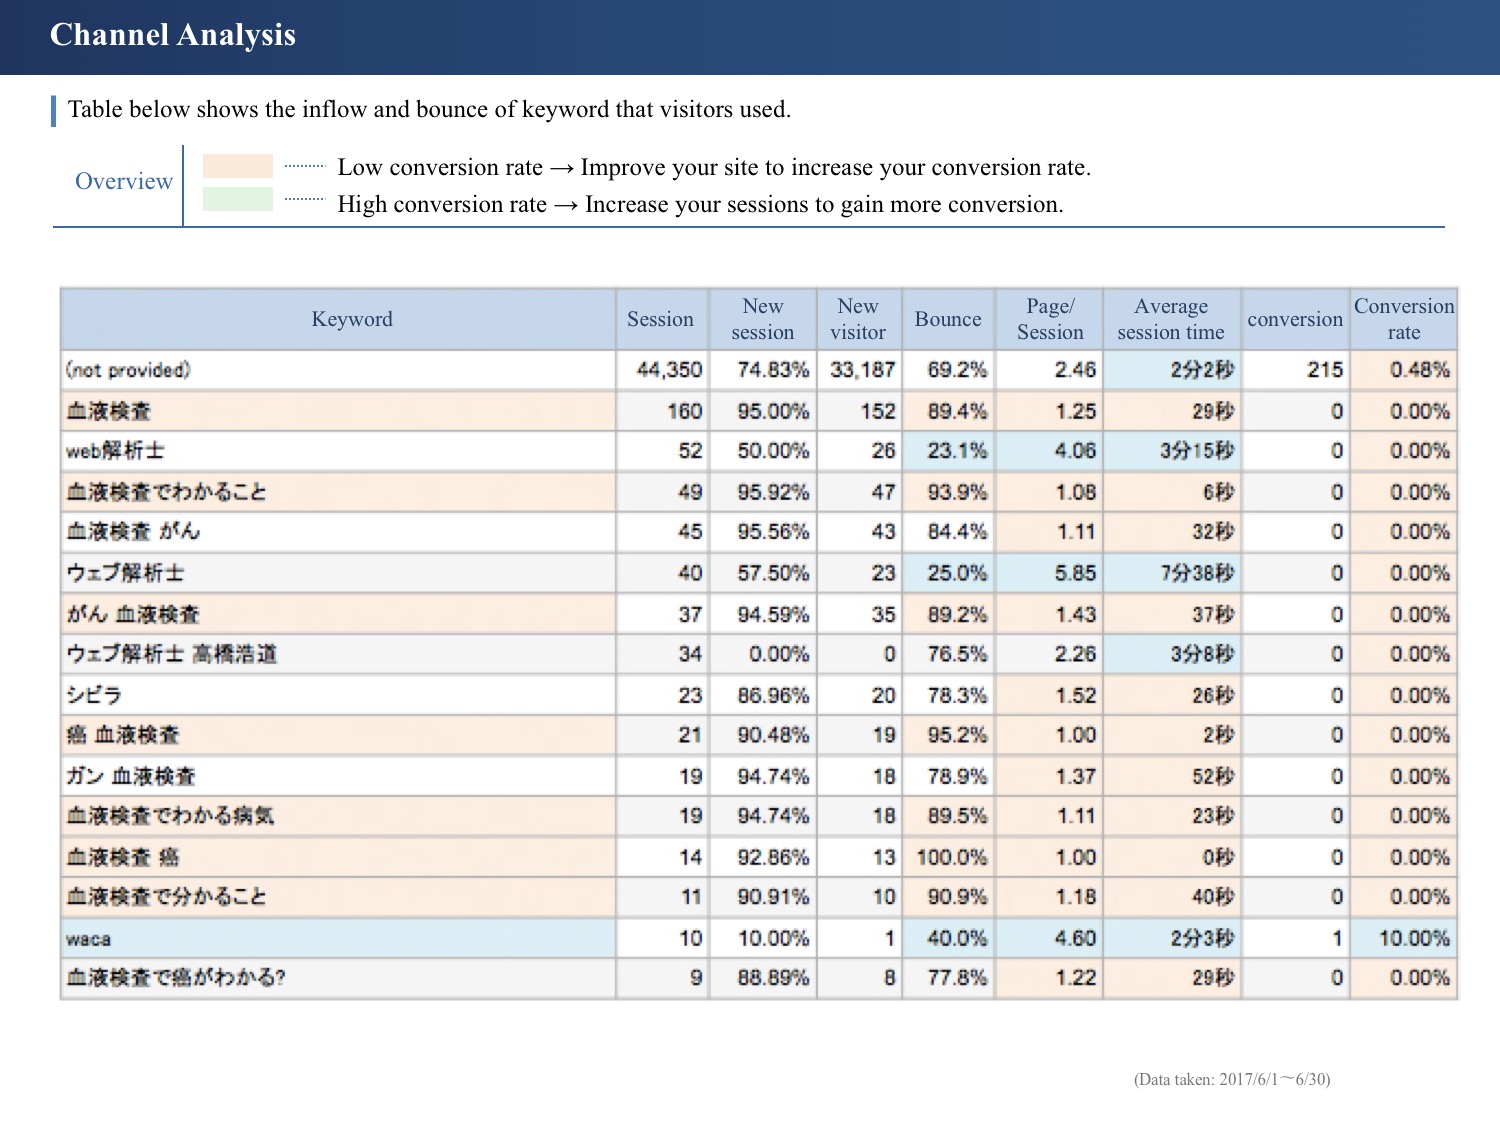
Here we have the keyword analysis. The result surprised me. I had never imagined, even in my dreams, that the keywords “血液検査 (blood test)” would bring in such a significant amount of inflow.
To find out why these keywords caused the inflow, I found the following article.
I honestly think this article is irrelevant to web analytics consultants, don’t you?
Sorry, but I am not being disrespectful to anyone here. However, in spite of the tremendous amount of inflow, the conversation count is zilch. You cannot imagine someone who is researching cancer would come up with the idea of obtaining a Web Analytics Consultant certification.
If you could ask the author of this article to add the characteristics of the inflow to cancer-related websites or something web marketing-related below the main body of research, you might have the chance to obtain conversions just because the inflow is unbelievably huge.
Proposal for Website Improvement
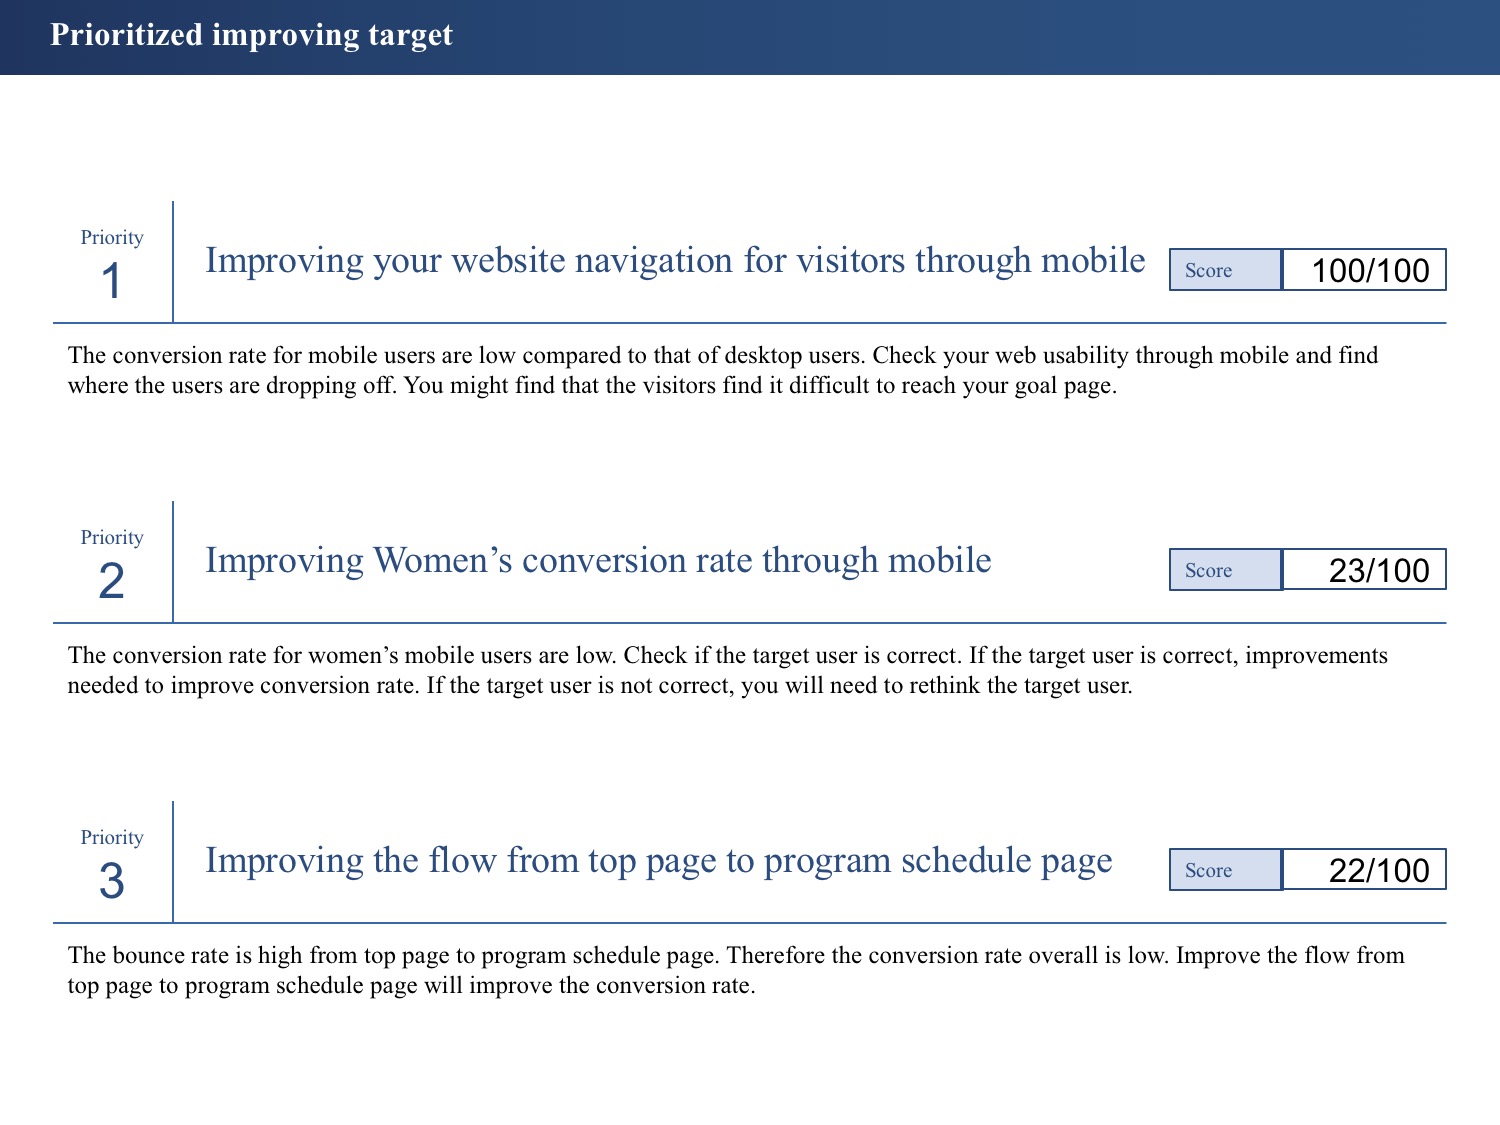
Lastly, the improvement proposals are presented.
KOBIT makes various data comparisons and presents the measures you can take in order of the impact after their implementation. First: improvements targeting smartphone users; second: improvements targeting women users; and third: improvements on funnels.
You already found out about smartphone users that the younger, the higher, and the older, the lower the conversion rate is. Also, if you look at websites specialized in certifications geared towards women in different industries, you can clearly see the differences in the tone and manner used. Therefore, you will be able to implement beneficial campaigns and measures targeting previously untargeted user groups by closely examining the current issues and renovating your website with a new design while you conduct women’s group discussions and other research to find clues for improvement.
The Role of Web Analytics Consultants Elucidated
KOBIT is a very useful service because it automatically generates reports. Having said that, the value of KOBIT increases many times over if web analytics consultants first output a KOBIT report and then create and verify their hypothesis as I showed you in this article. I described five types of frequent cases at the top of this article, but web analytics consultants can solve those five troubles with KOBIT and use their brains for analyses that lead their clients to better websites. New opportunities to improve websites will present themselves in front of your eyes.
On a personal note, I work on KOBIT to speed up human evolution. The more websites with higher conversion rates are created, the more interesting and beneficial websites will appear, and hence, the world will become a more interesting place.
For a web analytics consultant, KOBIT is not an enemy, of course, but a lovable, younger colleague. As KOBIT does a meticulous report creation, analytics consultants can work with the clients with whom they want to work in the first place. I hope to help create a better social system by doing so myself.
Thank you very much for reading this long article to the end.

Founder, Creators NEXT Co., Ltd. Born in New York, United States. Graduated from Keio University―Faculty of Policy Management. Senior Web Analytics Consultant. Started the business at 19; the company is in its 10th year in 2017. Provides SEO consulting for government ministries and agencies, and manufacturers, as well as in the real estate field of the medical long-term care industry. Engages in the provision of SEO solutions and web analytics; produces results in increased sales and cost reduction. Created his first website when in middle school. Succeeded in achieving the top member count for the word-of-mouth communication site “Seniors’ Homes Map” in the long-term care industry in three years. His company was selected as one of the top 100 growing enterprises with leaders in their 20s. The access analysis tool KOBIT has been used by over 500 companies in the two years since its release.


;>/img/banner/partner $url=>$index; .png)
No comments yet.